Automated Demand Signal Monitoring for Vacation Rental Managers
Discover how automated demand signal monitoring can boost your vacation rental revenue through real-time pricing and occupancy insights.

Automated Demand Signal Monitoring for Vacation Rental Managers
Automated demand-signal monitoring continuously collects booking- and market-level signals — search interest, booking pace, cancellations, ADR, occupancy — and turns them into real-time actions: dynamic pricing, minimum-stay controls, and operational triggers that increase RevPAR while cutting manual work. The payoff is faster reaction time, fewer missed revenue windows, and a portfolio that essentially reprices itself.
Two actions to take right now:
- Run a data audit on your PMS and channel connections to confirm you have clean, date-stamped records for occupancy, ADR, and booking pace to ensure data quality.
- Start a 30-day pilot on a representative subset of properties (mix of unit types and markets) with your PMS and booking-channel APIs connected before adding any automation rules.
The single task you can complete today: pull a baseline report covering occupancy, ADR, and cancellation rate by property for the last 90 days. That snapshot becomes your control benchmark.
Key Takeaways
Automated demand-signal monitoring works when you connect first-party PMS data to a rules engine with hard guardrails, run a staged pilot before full automation, and review outcomes monthly to keep the system calibrated.
| Point | Details |
|---|---|
| Start with a data audit | Pull 12 months of occupancy, ADR, and cancellation data from your PMS before connecting any automation. |
| Stage the rollout | Move from reporting-only to hybrid approvals to limited auto-execution; this reduces miscalibration risk. |
| Weight signals by context | Festival and major event demand support early rate-holds; typical weekend and minor holiday demand benefit from continuous dynamic adjustment. The signal-weighting and operational recommendations are conditional on demand type. |
| Measure RevPAR, not just occupancy | ADR, booking pace, and RevPAR together reveal whether automation is capturing revenue or just filling beds. |
| Realtevoos as your command center | Realtevoos provides pre-built channel integrations, a configurable rules engine, and owner-reporting automation for a guided pilot rollout. |
Table of Contents
- What “demand signals” actually means for vacation rentals
- Which signals move revenue most, and how context changes their weight
- Where to get these signals — integrations and data sources for U.S. managers
- How to design an automated demand-signal monitoring system
- Step-by-step implementation checklist and pilot timeline
- Measuring success: KPIs, dashboards, and testing the automation
- Risks, platform policies, and operational guardrails
- How Realtevoos implements automated demand-signal monitoring
- Data privacy and compliance for vacation rental guest data
- A perspective on what actually matters in automation rollouts
- Realtevoos gives you the pilot infrastructure, not just the playbook
- Sources
What “demand signals” actually means for vacation rentals
In the vacation rental context, a demand signal is any measurable data point that predicts or reflects near-term booking intent before or after a reservation is confirmed. The industry term you’ll see in revenue-management circles is booking signal or demand indicator, and the set that matters most breaks into two buckets: booking signals and market signals.
Booking signals come from your own channels:
- Search interest and listing impressions — how often your listing appears in platform search results
- Booking pace and lead velocity — how quickly reservations accumulate for a future date window
- ADR (Average Daily Rate) — the average nightly rate across confirmed bookings
- Cancellations — rate and timing of cancellations relative to check-in date
- Length-of-stay (LOS) shifts — whether guests are booking shorter or longer stays than your historical norm
- Enquiry and conversion rate — the ratio of contact-form or message inquiries that convert to bookings
Market signals come from outside your portfolio:
- Local event calendars, competitor rate changes, Google Trends volume, and weather forecasts
A short spike in search impressions without a booking-pace increase usually signals price sensitivity — guests are looking but not committing. A sustained multi-week rise in both impressions and pace signals genuine demand you can monitor occupancy rates against and price upward with confidence. As practitioner guidance confirms, search trends and booking pace can surface demand weeks before reservations actually land.
Which signals move revenue most, and how context changes their weight
Not all signals deserve equal attention. Here’s how to rank them for a typical U.S. vacation rental portfolio:
- Booking pace vs. baseline — the single highest-signal metric. If pace is notably ahead of the same window last year, you have pricing room. If supply in your market has grown, flat pace may still be a strong result.
- Search volume and listing impressions — leading indicator; moves before bookings do.
- ADR in your competitive set — tells you whether competitors are already capturing the demand you’re seeing.
- Cancellation rate and timing — late cancellations on high-demand dates are an opportunity to reprice; early cancellations on shoulder dates signal a demand problem.
- Length-of-stay shifts — a sudden drop in average LOS on peak weekends often means guests are splitting stays across multiple properties; a minimum-stay rule adjustment can recover revenue.
- Enquiry-to-booking conversion rate — a falling conversion rate at a stable price usually means the market has shifted, not that your listing has a problem.
Context changes everything. According to MDPI analysis of platform-certified signals, festival-driven demand is highly predictable and typically supports holding rates for a premium upfront, while weekend demand is more variable and benefits from more dynamic, frequent price adjustments. That distinction has a direct operational implication: for a confirmed festival or major event, set your rate early and hold it, but for regular weekends and minor holidays, keep your rules engine active to enable ongoing price adjustments. The signal-weighting and rate-setting profile should be tailored: “festival/event” profiles lock rates after strong pace confirms demand, while “standard weekend” profiles stay dynamic throughout the booking window.
Pro Tip: Build two signal-weighting profiles in your rules engine: a “festival/event” profile that locks rates once a threshold pace is hit, and a “standard weekend” profile that continues adjusting through the booking window.
Where to get these signals — integrations and data sources for U.S. managers
A reliable signal stack for a U.S. portfolio typically draws from three layers:
Channel and booking-platform signals:
- Airbnb and Vrbo partner APIs deliver listing impressions, search ranking position, and booking confirmations in near real time.
- Your channel manager aggregates inventory and rate data across platforms into a single feed.
Operational sources:
- Your PMS exports occupancy, booking pace, and cancellation data — this is your gold-standard first-party data for accurate benchmarking.
- Direct-booking engine logs capture enquiry volume and conversion rates that OTA dashboards never show you.
Market signals:
- Google Trends tracks search volume for destination keywords and surfaces demand shifts weeks ahead of bookings.
- Local event calendars (city tourism boards, Eventbrite, venue websites) flag festival and conference dates.
- Weather APIs add short-range demand context for outdoor-dependent markets.
Integration patterns to know:
- Real-time webhooks push booking events instantly; use them for pace tracking and cancellation alerts.
- Periodic API pulls (every 1–4 hours) work well for rate and inventory sync.
- Daily batch jobs handle historical occupancy, ADR aggregation, and market-benchmark imports.
Pro Tip: Prioritize integrating your direct reservation feed from the PMS first. OTA data arrives with platform-imposed delays; your own PMS data has no such lag and gives you the cleanest baseline for all downstream automation.
How to design an automated demand-signal monitoring system
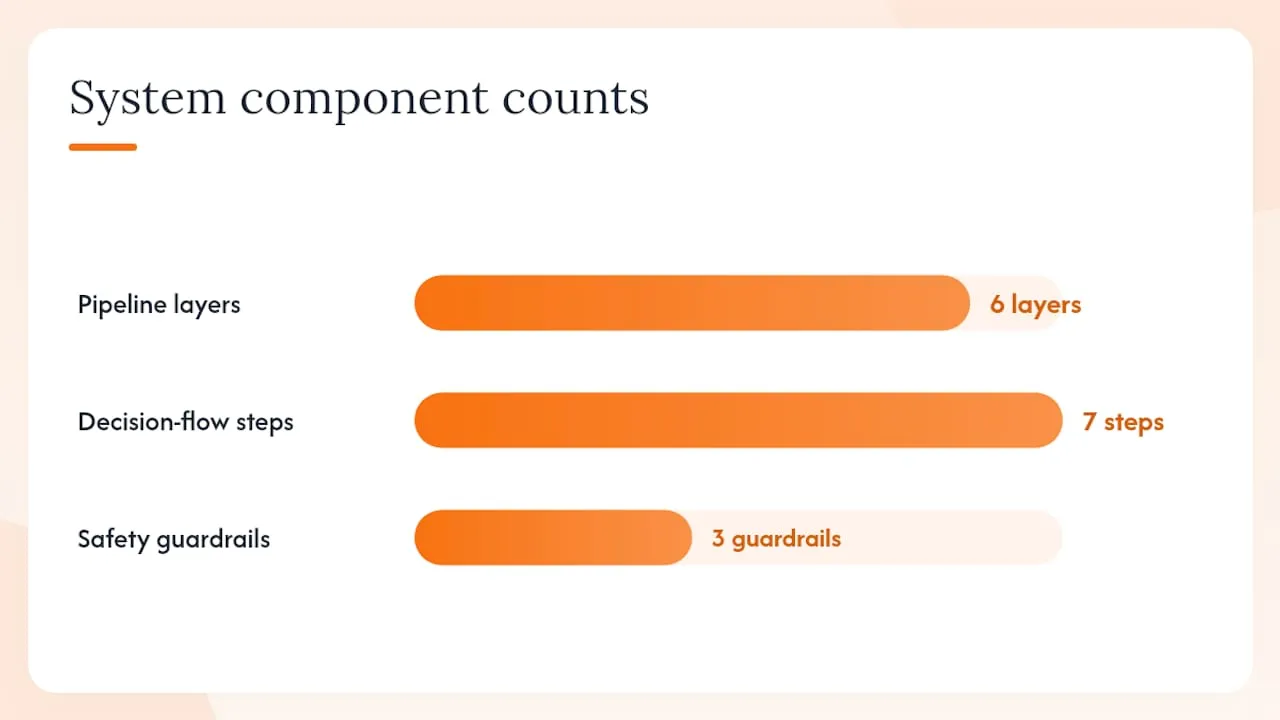
A production-ready pipeline has six layers:
- Ingestion layer — API connectors and webhooks pull data from your PMS, channel manager, OTA partner APIs, Google Trends, and event feeds.
- Normalization layer — standardizes time zones, currencies, rate floors/ceilings, and property identifiers so signals from different sources are comparable.
- Signal store — a time-series database that holds rolling 90-day and 12-month windows for each property and market.
- Analytics and scoring layer — calculates pace vs. baseline, ADR gap vs. comp set, and a composite demand score per date window.
- Rules engine / ML scorer — applies weighted rules (or a trained model) to generate a recommended action with a confidence score.
- Action layer — executes pricing updates, minimum-stay changes, or operational triggers (cleaning schedule, maintenance flags) when confidence clears a threshold.
The decision flow runs: signal detection → score/weight → confidence threshold → recommended action → approval gating → automated execution → post-action measurement feedback loop.
Safety guardrails are non-negotiable. Set hard price floors and ceilings per property, cap automatic rate moves at no more than 12% per trigger event, and require human approval for any change on dates within a high-revenue window (holidays, confirmed events). Dynamic pricing tools can push toward occupancy at the expense of RevPAR without these guardrails in place.
Pro Tip: Build a decision-flow diagram with nodes for each layer above, including a “rollback” node. When an automated action produces an anomalous outcome — a sudden cancellation spike, for example — the rollback node should revert the rate change and flag the event for human review.
Step-by-step implementation checklist and pilot timeline
A staged rollout — reporting-only first, then hybrid approvals, then limited automatic moves — reduces miscalibration risk and builds team confidence.
- Data audit (Week 1): Confirm 12 months of clean occupancy, ADR, and cancellation data in your property management system. Identify gaps.
- Baseline KPIs (Week 1): Record current RevPAR, ADR, occupancy, and average booking lead time per property from available reports.
- Select pilot properties (Week 1): Choose 5–10 properties that represent your portfolio mix (unit types, markets, price tiers).
- Connect PMS and channel APIs (Weeks 1–2): Authenticate integrations; validate data flow with test pulls.
- Configure normalization (Week 2): Set time-zone rules, currency handling, and property-ID mapping based on system standards.
- Set initial rule set and guardrails (Week 2): Define price floors/ceilings, LOS minimums, and the 12% auto-move cap.
- Reporting-only phase (Weeks 3–6): System generates recommendations but takes no automated action. Review daily.
- Hybrid approval phase (Weeks 6–8): Low-confidence recommendations require human approval; high-confidence moves execute automatically within guardrails.
- Limited automation phase (Weeks 8–12): Expand automatic execution to the full pilot set; monitor KPIs weekly.
- Post-pilot review (Week 12): Compare RevPAR, ADR, and occupancy against baseline. Decide on portfolio rollout.
Cost buckets to plan for: integration engineering time (typically the largest upfront cost), PMS and channel API subscription tiers, a pricing-engine or revenue-management platform subscription, staff review time during the hybrid phase, and optional guided onboarding services.
Measuring success: KPIs, dashboards, and testing the automation
Primary KPIs — track these against your pre-pilot baseline:
- RevPAR, ADR, and occupancy rate (the core vacation rental analytics triad)
- Booking pace vs. same-period prior year
- Average booking lead time (days)
- Cancellation rate
Secondary operational metrics: cleaning and maintenance schedule efficiency, guest satisfaction scores, and owner satisfaction.
For A/B testing, run automation on your pilot set while holding a matched control group of similar properties on manual pricing. A full booking window of 60–90 days gives you enough data to measure RevPAR lift and booking pace improvement without seasonal noise. Watch for unintended effects: a cancellation spike or a drop in guest satisfaction scores can signal that automated rate moves are creating expectation mismatches.
Stat to track: When supply in your market grows faster than demand, holding last year’s occupancy rate is itself a strong result. Always benchmark pace against active market supply, not just your own history.
Dashboard setup: configure real-time alerts for signal spikes (pace running more than 15% above baseline), a weekly effect-summary report comparing automated vs. manual outcomes, and post-action attribution that ties each rate change to its booking result. A data-driven rental strategy depends on that attribution loop closing cleanly.
Risks, platform policies, and operational guardrails
Key risks to manage:
- Over-automation — unconstrained rules engines can trigger race-to-the-bottom pricing during soft demand periods. Floors prevent this.
- API and TOS violations — scraping OTA pages or using unofficial endpoints violates platform terms and can result in listing suspension. Use only official partner APIs.
- Data integrity failures — timezone mismatches, duplicate booking records, and stale cache data are the most common causes of bad automated decisions.
- Owner relations risk — automated rate changes that owners see without context erode trust. A notification policy is required.
Governance checklist:
- Review Airbnb and Vrbo API terms of service before each integration update.
- Define a data-retention policy for guest PII (names, contact details, payment references) in line with applicable state privacy laws.
- Send owners a weekly automated summary of rate changes and the signals that triggered them.
- Require human approval for any automated action during the top 20% of revenue dates.
- Maintain audit logs for every automated action with timestamps, signal values, and outcomes.
Pro Tip: Set a calendar reminder to re-authenticate all API keys every 60 days. Expired credentials are the most common cause of silent data gaps — your system keeps running, but on stale data.
Common troubleshooting: auth expiry (check API credential status first), data-mapping errors (validate property-ID consistency across sources), and timezone bugs (confirm all timestamps are stored in UTC and converted at display time). Real-time property monitoring practices can catch these failures before they affect pricing decisions.

How Realtevoos implements automated demand-signal monitoring
Realtevoos is built around exactly the architecture described above. Its platform connects directly to Airbnb, Vrbo, Guesty, Hostaway, and other common PMS and channel managers, pulling booking pace, occupancy, and rate data into a unified dashboard without manual exports.
Platform capabilities that map to the pipeline:
- Native PMS and channel-manager integrations for real-time signal ingestion
- AI-driven rules engine that scores demand and generates pricing and minimum-stay recommendations
- Automation deck for executing approved actions across the full portfolio
- Owner-facing reporting with automated weekly summaries
- Audit logs with full action history and signal attribution
- DocuSign-connected document workflows for owner approvals on high-impact changes
Property managers using Realtevoos report saving several hours each week previously spent on manual rate reviews and cross-platform reporting. The platform’s AI layer handles the signal-scoring and recommendation generation, so the manager’s time shifts from data collection to decision review — exactly the hybrid model the staged rollout approach recommends.
The occupancy optimization strategy that Realtevoos enables follows the three-part stack practitioners recommend: PMS data as the foundation, a pricing engine for automation, and market-benchmark data for context.
Data privacy and compliance for vacation rental guest data
Vacation rental booking data carries personal information — guest names, contact details, payment references, and stay history — that falls under a growing patchwork of U.S. state privacy laws. California’s CCPA, Virginia’s VCDPA, and Colorado’s CPA each impose data-subject rights and retention obligations that apply when you store or process guest records in an automated system.
Practical compliance steps for your monitoring pipeline:
- Classify guest PII separately from aggregated booking metrics in your data store. Automation rules should operate on anonymized signals (booking pace, ADR, LOS) rather than identifiable guest records.
- Define and document a data-retention schedule: most operators retain reservation records for 3–7 years for tax purposes, but raw contact data can be purged sooner.
- Confirm that any third-party data processor (your PMS vendor, pricing engine, or analytics platform) has a Data Processing Agreement (DPA) in place and complies with the state laws applicable to your guest base.
- If you collect direct-booking enquiry data through a web form, your privacy policy must disclose how that data is used and stored.
Automated systems that aggregate signals across properties can inadvertently create guest profiles that trigger additional obligations under state law. Keep the signal layer and the guest-identity layer architecturally separate from the start — retrofitting that separation later is significantly more expensive.
A perspective on what actually matters in automation rollouts
The managers who get the most out of automated demand-signal monitoring are not the ones with the most signals. They’re the ones who picked two or three high-quality inputs, validated them against real booking outcomes, and built guardrails before they expanded the rule set.
The most common mistake is treating automation as a set-and-forget system. Demand patterns shift — a new competitor enters your market, a recurring festival moves dates, a platform algorithm update changes how impressions are counted. A monitoring system that isn’t reviewed on a monthly cadence drifts from reality quietly, and by the time the revenue impact shows up in your KPIs, the cause is weeks old.
Owner communication is the other underrated piece. Owners who understand why a rate changed — “booking pace was running 18% ahead of last year on that weekend, so the system moved the rate up” — become advocates for the automation. Owners who see unexplained rate swings in their owner portal become obstacles to the whole program.
The recommendation: schedule a 30-minute monthly review of your top five automated decisions from the prior month. Compare the signal that triggered each action to the booking outcome it produced. That single habit compounds into a significantly better-calibrated system within two quarters.
Realtevoos gives you the pilot infrastructure, not just the playbook
Most managers who read a guide like this face the same gap: the architecture makes sense, but building the integrations, normalization layer, and rules engine from scratch takes months of engineering time and a budget most portfolios can’t justify.

Realtevoos closes that gap. The platform ships with pre-built connectors for Airbnb, Vrbo, Guesty, and Hostaway, a configurable rules engine with guardrail templates, and a real-time dashboard that surfaces booking pace, ADR, and occupancy signals in one place. Property managers report saving several hours per week once the system is live — time that goes back into owner relationships and portfolio growth, not spreadsheet maintenance.
The Realtevoos management deck includes everything you need to run the staged pilot described in this guide: channel connectors, rule templates, owner-reporting automation, and audit logs. Onboarding is guided, not self-serve, so your first pilot property can be live within days rather than weeks. Start your pilot at Realtevoos and see your demand signals in a single command center before your next peak season.
Sources
External research cited in this guide:
- Peak-Season Price Adjustments in Shared Accommodation: The Role of Platform-Certified Signals and User-Generated Signals
- How to Forecast Demand for Short-Term Rentals
- How Dynamic Pricing Works in Short-Term Rentals (2026)
- Dynamic Pricing & Demand in Short-Term Rentals | AlkunMedia
- Vacation Rental Analytics: Key Metrics and Insights for Managers | Key Data
Realtevoos blog resources for implementation: