Dashboards that drive vacation rental performance
Discover the vital role of dashboards in property management. Learn how to optimize your vacation rental performance and boost revenue today!

Dashboards that drive vacation rental performance
Most property managers assume the key to better operations is a more attractive dashboard. Clean charts, color-coded metrics, a polished interface. But the reality is harder to swallow: the majority of vacation rental dashboards fail their users not because they look bad, but because they display the wrong metrics on the wrong schedule to the wrong people. Getting dashboards right means rethinking how data connects to decisions, and that shift can directly impact your revenue, occupancy, and guest satisfaction in measurable ways.
Table of Contents
- Why dashboards matter for property management
- Role-based dashboards: Tailoring for impact
- Operational cadence: Keeping dashboards relevant
- Integrating PMS and benchmarking: Powering advanced dashboards
- What most property managers overlook about dashboard effectiveness
- Next steps: Unlock your property’s performance
- Frequently asked questions
Key Takeaways
| Point | Details |
|---|---|
| Prioritize role-based views | Effective dashboards support unique workflows for each stakeholder in property management. |
| Refresh dashboards regularly | Dashboards must be updated in sync with decision cycles to maintain their value. |
| Integrate PMS for accuracy | Direct connections with PMS enable accurate, real-time performance metrics for vacation rentals. |
| Focus on actionable metrics | Define and monitor KPIs that drive weekly and monthly decisions, not just visual appeal. |
| Avoid stale data pitfalls | Failure to update dashboards leads teams to revert to manual spreadsheets, undermining ongoing optimization. |
Why dashboards matter for property management
A dashboard’s true job is not to summarize what already happened. It’s to tell you what to do next. For vacation rental operators managing multiple properties across channels like Airbnb and Vrbo, the gap between those two purposes is where performance gets lost.
Real-time operational awareness is the foundation. When a booking pace drops mid-week, you need to see it that day, not during a Friday review meeting. When a maintenance ticket goes unanswered for 36 hours, a dashboard should surface it before a guest checks in. These are not passive reporting functions. They are operational triggers.
“A dashboard that doesn’t connect to decisions is just a report with better fonts.”
Vacation rental dashboards work best when they are treated as living operational tools rather than static summaries. That distinction changes everything about how you build, configure, and review them.
Role-based design also plays a critical part. An owner needs to know whether her property is generating the expected returns this quarter. An onsite manager needs to know which checkout is delayed and which guest left a complaint. A maintenance coordinator needs to see the three open work orders due today. These people share the same portfolio, but they absolutely do not share the same information needs.
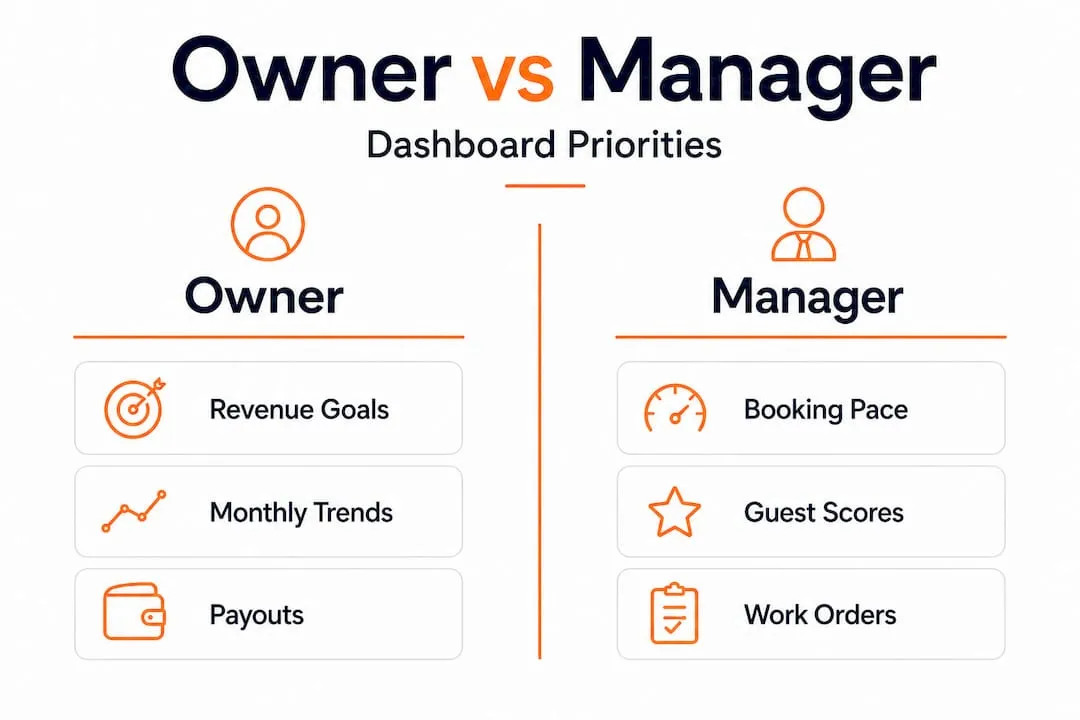
According to solid dashboard methodology, effective property management dashboards rely on role-based views and operational cadence to drive real impact.
Key reasons dashboards are essential in vacation rental operations:
- They replace reactive management with proactive decision-making
- They consolidate data from multiple booking channels into a single view
- They reduce the time spent hunting for information across disconnected systems
- They create accountability by making performance visible to the right people
- They support owner communication with accurate, real-time reporting
The refresh cadence, meaning how often dashboard data is updated, is directly tied to decision quality. A dashboard updated once a week is fine for strategic reviews. For daily operations, you need data updated every few hours at minimum. Getting that cadence wrong is one of the most common and most costly mistakes vacation rental managers make.
Role-based dashboards: Tailoring for impact
Not every metric matters to every person on your team. This sounds obvious, but the default behavior for most platforms is to build one dashboard and hand it to everyone. The result is that nobody finds it useful, adoption drops, and teams revert to the tools they already understand.
Property manager dashboard features should be designed around who acts on what information, and with what frequency.
Owners want financial clarity. Their core questions are: How is my property performing this month compared to last? What is my projected revenue for the next 90 days? How does my occupancy compare to the local market? Metrics like ADR (average daily rate), RevPAR (revenue per available room), net owner income, and trailing 12-month revenue are what matter to them.
Onsite managers operate at a faster pace. They care about booking pace for the next 30 days, guest satisfaction scores from recent stays, pending maintenance requests, and check-in or checkout issues. Their dashboard needs to surface urgency, not strategy.

Maintenance teams are focused on execution. Open work orders, parts inventory, average response time, and escalation flags are their language. Showing them occupancy curves and revenue charts wastes their attention and dilutes the signal.
Here is a practical comparison of dashboard needs across stakeholders:
| Stakeholder | Primary metrics | Review frequency | Key actions triggered |
|---|---|---|---|
| Property owner | ADR, RevPAR, net income | Monthly | Pricing adjustments, reinvestment |
| Onsite manager | Booking pace, guest scores | Daily | Staffing, guest issue response |
| Maintenance team | Work orders, response time | Daily | Prioritize repairs, restock inventory |
| Revenue manager | Occupancy, channel mix | Weekly | Rate strategy, promotional decisions |
Pro Tip: Before building any dashboard view, ask the end user what decision they make most often and what slows them down. Build the dashboard around that answer, not around what data is available.
One common mistake is building dashboards that impress stakeholders during quarterly reviews but fail during daily operations. The metrics that look good in a presentation are often not the same as the ones that drive moment-to-moment decisions. Role-based dashboards are foundational precisely because one-size-fits-all views fail when stakeholders need to act on different information.
To implement role-based dashboards effectively, follow this sequence:
- Map out each user role and their primary operational decisions
- Identify the three to five metrics most relevant to each decision
- Define the acceptable data refresh rate for each role
- Remove any metric from a role’s view that doesn’t directly support a decision
- Test the dashboard with actual users and revise based on what they actually look at
Operational cadence: Keeping dashboards relevant
You can build the most sophisticated dashboard on the market, and it will still fail if the data inside it is three days old. Operational cadence is the rhythm at which your dashboard syncs with your systems, and it’s the single biggest factor in whether your team actually uses it.
Live vacation rental analytics require direct integration with your property management system (PMS), booking channels, finance tools, and maintenance platforms. Without that integration, someone is manually entering data, and manual data entry introduces lag, errors, and the slow death of dashboard trust.
Typical review cadences for vacation rental operations:
| Review type | Frequency | Key metrics reviewed | Team involved |
|---|---|---|---|
| Operational check-in | Daily | Open work orders, check-in status, guest issues | Managers, maintenance |
| Booking performance | Weekly | Pace, occupancy, channel mix | Revenue and ops teams |
| Financial review | Monthly | ADR, RevPAR, net income, expenses | Owners, finance |
| Strategic assessment | Quarterly | Market benchmarks, YoY trends | Leadership, owners |
Adoption is directly tied to how well the dashboard’s refresh schedule matches the team’s decision-making rhythm. A weekly review meeting built around live dashboard data creates a ritual. That ritual creates habits. Those habits create accountability.
Here’s a sobering reality: stale or mismatched metrics cause teams to abandon dashboards and revert to spreadsheets. This isn’t a failure of the team. It’s a failure of the system design. When a manager pulls up a dashboard and sees maintenance data that’s 48 hours old, they stop trusting it and build their own workaround. Spreadsheets then fragment across team members, errors multiply, and the promise of centralized intelligence evaporates.
Avoiding this requires a few deliberate practices:
- Establish automated sync schedules between your PMS and dashboard tools
- Set up alerts when data feeds fail or fall out of sync
- Assign a dashboard owner on your team who audits data accuracy weekly
- Create a shared definition for every metric so no one disputes what the numbers mean
- Tie specific KPI reviews to your existing team meeting schedule
The goal is to make dashboard review feel less like an extra task and more like the natural way your team already operates.
Integrating PMS and benchmarking: Powering advanced dashboards
Once your operational cadence is locked in, the next performance lever is integration depth. A dashboard connected directly to your PMS gives you accurate, timely metrics without manual effort. One that also incorporates live market benchmarking transforms from an internal reporting tool into a competitive intelligence system.
PMS integration benefits go beyond simple data display. When your dashboard pulls directly from your booking engine, you see occupancy and ADR in real time, revenue forecasts update automatically as bookings come in, and owner reports generate themselves instead of eating hours each month.
Live benchmarking takes this further. Instead of knowing only how your properties performed last month, you can see how that performance compares against anonymized market peers in the same geography and property category. That context changes decisions. A 78% occupancy rate looks strong until you see the market average is 85%.
First-party PMS-connected benchmarking is now scalable through advanced dashboard platforms, supporting custom reporting for internal teams, owners, and investors.
Key capabilities unlocked through deep integration:
- Occupancy tracking across all channels in a single view, including Airbnb, Vrbo, and direct bookings
- ADR and RevPAR monitoring updated in real time, not at month’s end
- Owner reporting automation that eliminates manual formatting and calculation errors
- Revenue manager alerts when occupancy trends suggest pricing adjustments are needed
- Guest experience scores connected to specific properties and stay dates for root cause analysis
Pro Tip: When setting up benchmarking, use anonymized peer data rather than relying on self-reported market stats. Anonymized benchmarking from integrated platforms gives you a more honest comparison than industry averages, which tend to skew based on who voluntarily reports.
Connecting guest experience enhancements to your dashboard data closes a loop that many operators leave open. When guest satisfaction scores drop for a specific property after maintenance delays, the connection becomes visible and actionable. That’s the operational intelligence advantage that separates growing portfolios from stagnant ones.
What most property managers overlook about dashboard effectiveness
Here’s the perspective that most platform vendors won’t tell you: the visual design of your dashboard is almost entirely irrelevant to its performance impact.
Operators spend weeks selecting platforms based on how the interface looks in a demo. They obsess over chart styles, color themes, and layout options. Meanwhile, the metrics being displayed are poorly defined, the data is refreshing on the wrong schedule, and nobody has agreed on what “occupancy” actually means in their organization. Is it based on available nights? Bookable nights? Does it include owner blocks?
Dashboard success depends on correct metric definitions, refresh cadence, and KPI alignment far more than on visualization quality. A basic bar chart showing the right number at the right time beats a beautiful interactive chart showing the wrong number every single time.
The advanced dashboard solutions that actually change operational outcomes share one trait: they are boring to look at and terrifying to ignore. The numbers mean something. The team argues about them in meetings. When a metric moves, someone is accountable.
The other thing managers overlook is the integration between dashboards and daily workflow. A dashboard reviewed once a month is a reporting document. A dashboard reviewed every morning during a five-minute standup is a management system. The platform matters less than the practice.
Our honest recommendation: invest the most time in defining your metrics precisely, mapping them to your PMS and operational systems accurately, and establishing review rituals that your team treats as non-negotiable. Then pick the platform that supports those requirements. Do not do it in the reverse order.
Next steps: Unlock your property’s performance
Understanding what makes dashboards work is step one. Putting that knowledge into a system your team actually uses is where the results show up.
RealtevoOS dashboard tools give vacation rental operators the real-time, role-based intelligence infrastructure this article describes, built specifically for multi-property management at scale. From live PMS integration and automated owner reporting to AI-driven maintenance escalation and guest satisfaction tracking, the platform connects every data point your team needs to a single, action-oriented interface. If your current dashboards are collecting dust or driving your team back to spreadsheets, it’s time to see what a system built around operational cadence and role-based intelligence can do for your portfolio.
Frequently asked questions
What are the key performance metrics to track in a property management dashboard?
Occupancy, ADR, RevPAR, guest satisfaction, maintenance response time, and booking pace are the core metrics, since dashboards connect directly to PMS systems for live performance benchmarking across all of these areas.
How often should dashboards be updated or reviewed?
Dashboards should be refreshed and reviewed on a cadence that matches your decision cycle, as adoption is directly linked to whether review frequency aligns with weekly or monthly operational rhythms.
Why do property managers revert to spreadsheets despite having dashboards?
Managers revert to spreadsheets when dashboards lose their trust, which happens when teams encounter stale metrics that aren’t reliably updated from operational systems.
What is the benefit of custom dashboards for owners versus managers?
Owners gain clarity on revenue and occupancy trends, while managers get a view focused on bookings, guest satisfaction, and maintenance, since role-based dashboard design recognizes that different stakeholders act on fundamentally different metrics.