Fix Your Data First: Portfolio Reporting for Multi Property Owners
Standardize PMS, accounting and bank feeds, adopt monthly/quarterly/annual cadences with a 30/60/90 rollout, and automate owner and investor reports using...

Fix Your Data First: Portfolio Reporting for Multi Property Owners
Portfolio reporting for rentals turns a stack of separate property statements into one consolidated business view, showing which units generate cash and which drag the whole operation down. It gives multi-property owners and managers a clear basis for capital decisions, from refinancing to selling underperformers. The single first move: standardize your data across your PMS, accounting system, and bank feeds before you build a single dashboard or report.
TL;DR:
- Standardizing data across PMS, accounting, and bank feeds is essential to ensure accurate, comparable metrics for portfolio management.
- Key metrics include net operating income, weighted cap rate, cash flow, occupancy, debt service coverage ratio, and loan-to-value, which guide critical decisions.
- Creating recurring, stakeholder-specific reports and dashboards that link directly to source transactions enhances tracking and decision-making.
- Automation and live integrations reduce manual work, improve data reliability, and enable timely insights for scaling portfolios.
- Proper reconciliation of cash and tax views prevents compliance risks and ensures reports meet lender and tax authority standards.
Table of Contents
- What Is Portfolio Reporting and Why Does It Matter?
- Which Portfolio Metrics Actually Matter?
- How Do You Build a Single Source of Truth?
- What Reporting Cadence and Templates Should You Use?
- What Should Your Portfolio Dashboard Actually Show?
- What Formats Should Your Reports Export To?
- RealtevoOS in Practice: How an Integrated SaaS Approach Handles Reporting
- Your 30, 60, and 90-Day Reporting Checklist
- Compliance and Regulatory Considerations for Rental Portfolio Reporting
- Best Practices for Integrating Third-Party Analytics Tools
- Common Challenges in Portfolio Reporting and How to Solve Them
- What the Data Actually Tells Multi-Property Owners
- See Portfolio Reporting Work the Way It Should
- Sources
What Is Portfolio Reporting and Why Does It Matter?
A per-property report tells you how one door performed last month. Portfolio reporting rolls every property into a single business view, so you can see the whole operation the way an investor or lender would. That distinction shows up in three aggregation layers: per-property (individual unit performance), per-entity (grouped by LLC or ownership structure), and portfolio (everything combined into one set of numbers).
This matters because capital allocation decisions only make sense at the portfolio level. A property manager looking at one statement at a time might miss that three units are quietly funding a fourth one’s losses. Portfolio-level metrics like weighted cap rate and consolidated cash flow expose that pattern immediately.
The portfolio view enables decisions that per-property reports simply cannot support:
- Deciding whether to refinance a strong performer to fund a new acquisition
- Identifying which property to sell when equity is trapped and underused
- Redeploying capital from a stagnant unit into a market with better appreciation
- Spotting which properties are worth renovating versus which should be exited
Once you can see the whole portfolio at once, resource allocation stops being a guess.
Which Portfolio Metrics Actually Matter?
Six metrics handle most of the decisions you’ll face as your portfolio grows: net operating income (NOI), weighted cap rate, occupancy, cash flow, debt service coverage ratio (DSCR), and loan-to-value (LTV). Add capital velocity, how fast your equity actually compounds across the portfolio, and you have a complete operating picture.
You need both a cash view and a tax view of these numbers. Cash flow tells you what’s actually available to distribute or reinvest. The tax view, adjusted for depreciation and other non-cash items, tells a different story to your CPA and to the IRS. Running only one view is how owners get surprised at tax time.
Weighted cap rate matters more than a simple average because it accounts for property value, not just unit count. A portfolio where one high-value property returns a lower rate and several smaller properties return a higher rate has a very different weighted cap rate than a flat average suggests.
Pro Tip: Watch for these metric combinations: rising occupancy with flat rent signals a rent increase opportunity; strong DSCR with low LTV flags a refinance candidate; declining NOI with high capex needs usually means it’s time to sell.
Capital velocity, how quickly your equity turns over into new returns, separates portfolios that compound from ones that stagnate even when individual properties look healthy.
How Do You Build a Single Source of Truth?
Inconsistent reports almost always trace back to one root cause: your systems define the same term differently. Your PMS might count a unit as “occupied” the moment a booking is confirmed, while your accounting software waits for the deposit to clear. Multiply that mismatch across a dozen properties and your occupancy numbers stop meaning anything.
Standardizing data into a single source of truth across your PMS, accounting platform, and bank feeds is the step that prevents this. Skip it, and every report you build afterward inherits the same inconsistencies.
- Map every general ledger code to one common chart of accounts across all properties and entities.
- Define occupancy and delinquency in exact, written terms, and apply that definition everywhere.
- Reconcile transactions against bank statements on a fixed schedule rather than trusting automated imports blindly.
- Set validation checks that flag mismatches between systems before they reach a report.
Manual reporting tends to break down exactly where these definitions diverge. Normalizing metrics early saves far more time than patching broken reports later.
Pro Tip: Build your GL mapping template once, in a spreadsheet or your reporting tool, and reuse it every time you onboard a new property. Retrofitting a mapping after six months of mismatched data is a much bigger job.
What Reporting Cadence and Templates Should You Use?
Three cadences cover almost every stakeholder need: a monthly operations report, a quarterly investor package, and an annual tax-aligned export. Each one answers a different question, for a different audience, and mixing them up wastes everyone’s time.
Monthly reports should stay tactical: cash flow, rent roll, delinquency status, and any urgent flags that need attention this week. Recommended cadences scale with portfolio size, and monthly is where operational problems surface first.
Quarterly packages step back and look at trends: consolidated P&L across the portfolio, capital velocity, a ranked list of refinance candidates, and property-by-property performance ranking. This is the report owners and investors actually read closely.
Annual and tax-time reporting needs a Schedule E–aligned view, full depreciation reconciliation, and exports your CPA can use without reformatting anything.
| Cadence | Core contents | Primary audience |
|---|---|---|
| Monthly | Cash flow, rent roll, delinquency, flags | Operations team |
| Quarterly | Consolidated P&L, capital velocity, refi candidates | Owners and investors |
| Annual/tax | Schedule E view, depreciation reconciliation | CPA and tax filing |
Templates for these packages don’t need to be reinvented each cycle; a repeatable reporting workflow makes each cadence a scheduled output instead of a scramble.
What Should Your Portfolio Dashboard Actually Show?
A dashboard earns its place only if it changes what you do next. Five panels cover most of what a multi-property operation needs: a portfolio P&L, a cash-flow waterfall, an NOI ranking of every property, an occupancy trend line, and a 90-day forecast with confidence bands.
Live dashboards that recalculate NOI, cap rate, and occupancy the moment a transaction posts let you see which property is carrying the portfolio in near real time, not three weeks after month-end close.
- Portfolio P&L, rolled up across every entity and property
- Cash-flow waterfall showing where money is coming from and where it’s going
- NOI ranking so underperformers are visible at a glance, not buried in a spreadsheet
- Occupancy trend line across the trailing 12 months
- 90-day forecast with confidence bands built from scheduled rent and known bills
Every KPI on the dashboard should link directly back to the source transactions and the per-property P&L behind it. A number you can’t drill into is a number you eventually stop trusting. Forecasting 90 days out using scheduled rent and known liabilities catches a tight cash week before it becomes a crisis, not after.
Pro Tip: Route alerts by role, not by volume. Operations staff need delinquency flags today; owners need a summary once a quarter, not a daily ping every time a tenant pays late.
What Formats Should Your Reports Export To?
A cash view and a tax view solve different problems, and conflating them creates confusion for owners and CPAs alike. The cash view shows what’s actually distributable today. The tax view, adjusted for depreciation and non-cash entries, is what your CPA needs at filing time.
Reports should export in multiple stakeholder-specific formats: CSV files for accountants who need raw data to manipulate, PDF packages for owners and banks who want a clean summary, and Schedule E–aligned spreadsheets built for tax prep.
- CSV exports for your accounting team or CPA to import directly
- PDF summaries for owners, lenders, and anyone who wants the answer without the raw ledger
- Schedule E–aligned spreadsheets that map cleanly to tax filing categories
- Scheduled, automated delivery to each recipient rather than manual emailing every cycle
Version and naming conventions matter more than they seem to at first. A folder full of files named “Report_final_v2” becomes unmanageable fast once you’re tracking a dozen properties across three entities. Sample templates in reporting examples for vacation rentals show what a clean, stakeholder-ready output actually looks like.
RealtevoOS in Practice: How an Integrated SaaS Approach Handles Reporting
RealtevoOS applies this exact standardization approach across every property a manager oversees. The platform pulls live feeds from Airbnb and Vrbo, accounting data, and bank transactions into one consolidated dashboard, replacing the spreadsheet stitching most multi-property operations still rely on.
Integrated platforms that consolidate PMS, bank, and accounting feeds cut down the weekly manual reporting hours that eat into a manager’s actual operating time. Automated owner digests and scheduled report delivery mean the same report goes out on the same day every cycle, without anyone building it from scratch.
- Live consolidation of Airbnb, Vrbo, accounting, and bank feeds into one dashboard
- Automated owner digests scheduled on a fixed cadence, not built manually each time
- Role-based report delivery, so operations, owners, and lenders each see the view built for them
- AI-driven signals that flag underperforming properties before quarterly review
Clients using consolidated PMS and bank-feed integrations report saving several hours each week that used to go into manual reporting, time that goes back into scaling the portfolio instead of formatting spreadsheets.
That time savings compounds as the portfolio grows, which is precisely when manual reporting stops scaling.
Your 30, 60, and 90-Day Reporting Checklist
Implementation doesn’t need to happen all at once. Spread it across three phases and each one builds on the last.
- Days 1 to 30: Pick one reporting cadence to start with (monthly is easiest), standardize your occupancy definition across every system, and turn on live bank feeds.
- Days 31 to 60: Automate rent-roll ingestion and schedule your first recurring owner digest.
- Days 61 to 90: Reconcile your cash and tax views, assemble your first quarterly investor package, and set filters that flag refinance or sell candidates automatically.
Compliance and Regulatory Considerations for Rental Portfolio Reporting
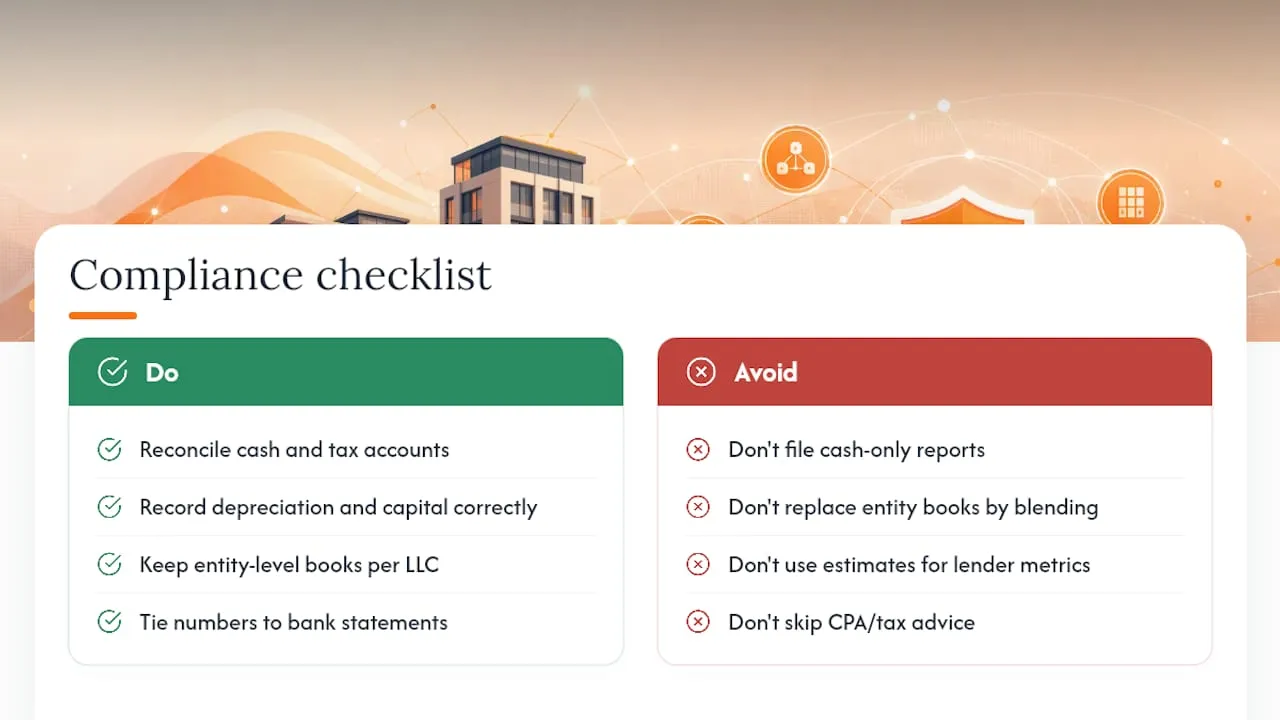
Portfolio reporting sits close to several compliance obligations, and getting the underlying numbers wrong doesn’t just create bad dashboards, it creates tax and lender exposure. The most immediate issue is the gap between cash accounting and tax accounting. Depreciation, capital improvements versus repairs, and the treatment of security deposits all get handled differently for tax purposes than they do in a straightforward cash-flow view. A report built exclusively on cash numbers can materially understate or overstate taxable income if it isn’t reconciled before filing season.
Owners with properties held across multiple LLCs or entities face an added layer: each entity typically needs its own set of books, even when the properties are managed as one operating portfolio. Blending entity-level financials into a single portfolio view is useful for decision-making, but it cannot replace entity-specific records required for tax filing or lender covenants.
Lenders reviewing DSCR and LTV for refinancing also expect numbers that tie back cleanly to bank statements and verifiable transaction records, not estimates. A portfolio report that can’t be traced to source documents invites scrutiny during underwriting.
Consult a CPA or tax professional familiar with real estate before finalizing how your reporting structure handles entity separation, depreciation schedules, or Schedule E alignment. Reporting software can organize and standardize the numbers; it doesn’t replace the judgment call on how a specific transaction should be classified for tax purposes.
Best Practices for Integrating Third-Party Analytics Tools
Most multi-property operations already run several disconnected tools before they ever build a portfolio dashboard: a PMS for bookings, QuickBooks or a similar system for accounting, and a bank feed for reconciliation. The mistake is trying to layer an analytics tool on top of all three without first confirming they agree with each other.
Start by testing data consistency before flipping on live integrations. Pull a sample month from each system and check that occupancy, revenue, and expense totals actually match across the PMS, accounting platform, and bank statement. Any analytics tool built on top of mismatched inputs will just produce a more polished version of the same errors.

Prioritize integrations with native, live connections over ones that rely on manual CSV uploads. A live connection catches discrepancies as they happen; a manual upload only catches them whenever someone remembers to run the import, which in practice means monthly at best.
Set validation rules inside the analytics layer itself, not just in the source systems.
Finally, treat every third-party analytics tool as a consumer of your standardized data, not a source of new definitions. If the analytics platform defines “occupancy” differently than your PMS does, you’ve reintroduced the exact inconsistency that standardization is supposed to eliminate.
Common Challenges in Portfolio Reporting and How to Solve Them
The most common failure point isn’t a lack of data. It’s too much data, defined inconsistently, arriving from too many places. A five-property portfolio might have five different rent roll formats, three different chart-of-accounts structures, and a bank feed that lags the PMS by several days. Reports built on top of that mess are technically accurate and practically useless.
Timing mismatches cause a second, quieter problem. Accrual-based accounting recognizes revenue when it’s earned; cash-based tracking recognizes it when it hits the bank. A report that blends both without labeling which is which will show numbers that don’t reconcile, and owners will notice.
A third challenge shows up as portfolios scale past five or six properties: manual reporting simply runs out of hours. What took an afternoon at three properties takes a full week at fifteen, and something eventually gets skipped, usually the reconciliation step that catches errors before they compound.
The fix for all three is the same standardization work covered earlier: one chart of accounts, one occupancy definition, reconciled bank feeds, and automated delivery on a fixed schedule. Solving the definitional inconsistency solves most of the downstream reporting pain automatically. Guest satisfaction metrics deserve the same discipline; customer review data in hospitality can reveal operational issues that financial metrics alone miss, particularly at properties where occupancy looks fine but repeat bookings are declining.
What the Data Actually Tells Multi-Property Owners
Most advice on rental reporting treats dashboards as the goal. They’re not. A dashboard is only as good as the data feeding it, and the industry spends far more energy on visualization than it does on the unglamorous work of making sure occupancy means the same thing in your PMS as it does in your accounting software.
The conventional advice tells owners to “track more metrics.” The better advice is to track fewer metrics, defined consistently, reconciled against real bank data. A weighted cap rate calculated from mismatched GL codes is worse than no cap rate at all, because it looks authoritative while quietly misleading you.
If you’re managing more than three properties and still building reports by hand, standardization should come before any dashboard purchase. Fix the definitions first. The reporting cadence, the export formats, even the dashboard panels, all of that is secondary to whether your underlying numbers actually agree with each other across systems.
— Jose Villeda
See Portfolio Reporting Work the Way It Should
Realtevoos is the alternative to piecing together spreadsheets, PMS exports, and bank statements by hand every reporting cycle. Instead of rebuilding the same reconciliation work every month, you get one dashboard where Airbnb, Vrbo, accounting, and bank feeds already agree with each other, and role-based reports go out automatically to owners, operations, and lenders without you formatting a single PDF.

If you’ve read this far, you already know the real bottleneck isn’t the dashboard design, it’s the data underneath it. The RealtevoOS management deck is built around exactly that: live consolidation, standardized metrics, and scheduled delivery, so your quarterly investor package builds itself instead of eating your weekend. Take a look at how the command center handles multi-property portfolios, and start a trial to see your own properties consolidated into one live view this month.
Sources
- Rental Portfolio Reporting FAQ | DoorVault
- Reporting & Dashboards | Revolution RE
- Rentari
- Reports — Cashflow Portal