Short-term rental KPIs: boost your property's performance
Unlock your rental's potential! Learn to explain short term rental KPIs and use them to boost your property's performance effectively.

Short-term rental KPIs: boost your property’s performance
Your occupancy rate just hit 92%. Congratulations, right? Not necessarily. If you achieved that number by slashing your nightly rate to fill every available night, you may actually be earning less than a competitor running at 70% occupancy with a premium price point. This is the trap that catches even experienced property managers, and it explains why reading RevPAR, ADR, and occupancy together rather than in isolation is the only reliable way to measure true performance. This article breaks down the essential short-term rental KPIs, shows you how to interpret them as a system, and gives you a clear path to turning raw data into smarter decisions.
Table of Contents
- Why KPIs matter in short-term rentals
- Core short-term rental KPIs every manager should know
- How to interpret multiple KPIs for real insights
- Turning KPI data into business decisions
- Why KPI mastery is more art than science
- A smarter way to manage your rental KPIs
- Frequently asked questions
Key Takeaways
| Point | Details |
|---|---|
| KPIs reveal true performance | Looking at several key metrics together gives a much clearer picture than tracking one in isolation. |
| Strike KPI balance | Combining occupancy, ADR, and RevPAR provides insights that help you avoid costly mistakes. |
| Act on your data | Use KPI findings to make timely adjustments and optimize both revenue and guest experience. |
| Interpret with context | KPI numbers only matter when you consider your market, strategy, and unique business goals. |
Why KPIs matter in short-term rentals
Key performance indicators, or KPIs, are measurable values that tell you how effectively your rental business is hitting its goals. For property managers overseeing multiple units across different markets, KPIs are not just report card numbers. They are early warning systems, opportunity detectors, and negotiation tools when talking to property owners.
Tracking the right KPIs consistently leads to real business outcomes:
- Higher revenue through better pricing decisions based on actual demand data
- Lower vacancy costs by identifying slow periods before they drain cash flow
- Stronger owner relationships because you can back every recommendation with numbers
- Faster scaling since you know which properties and markets are worth expanding into
- Smarter marketing spend by connecting property management marketing ideas to the metrics that actually move the needle
“A 95% occupancy rate at a low price may not outperform lower occupancy at higher rates.” This is why RevPAR, which captures both pricing and occupancy in a single figure, is often the most honest measure of revenue health.
The biggest KPI blind spot most managers have is treating occupancy as the headline metric and everything else as supporting detail. In reality, occupancy is just one variable in a three-way equation. A vacation rental KPI command center that surfaces all your metrics simultaneously is what separates reactive management from proactive strategy.
Pro Tip: Set a baseline for each KPI during your first full operating year. Without a baseline, you have no context for whether a 75% occupancy rate in March is a win or a warning sign.
Now that you know why looking past headline numbers is crucial, let’s define the essential KPIs every property manager should monitor.
Core short-term rental KPIs every manager should know
Understanding what each metric measures and how to calculate it is the foundation of smart KPI use. Here are the four most critical ones, plus two that often get overlooked.
Occupancy rate is the percentage of available nights that are actually booked. Formula: (Booked nights / Available nights) x 100. It tells you demand, but nothing about price.

Average Daily Rate (ADR) is the average revenue earned per booked night. Formula: Total room revenue / Number of booked nights. ADR tells you pricing power, but nothing about how often the property sits empty.
Revenue per Available Room (RevPAR) combines both. Formula: ADR x Occupancy Rate, or Total revenue / Available nights. This is your single most useful revenue health metric.
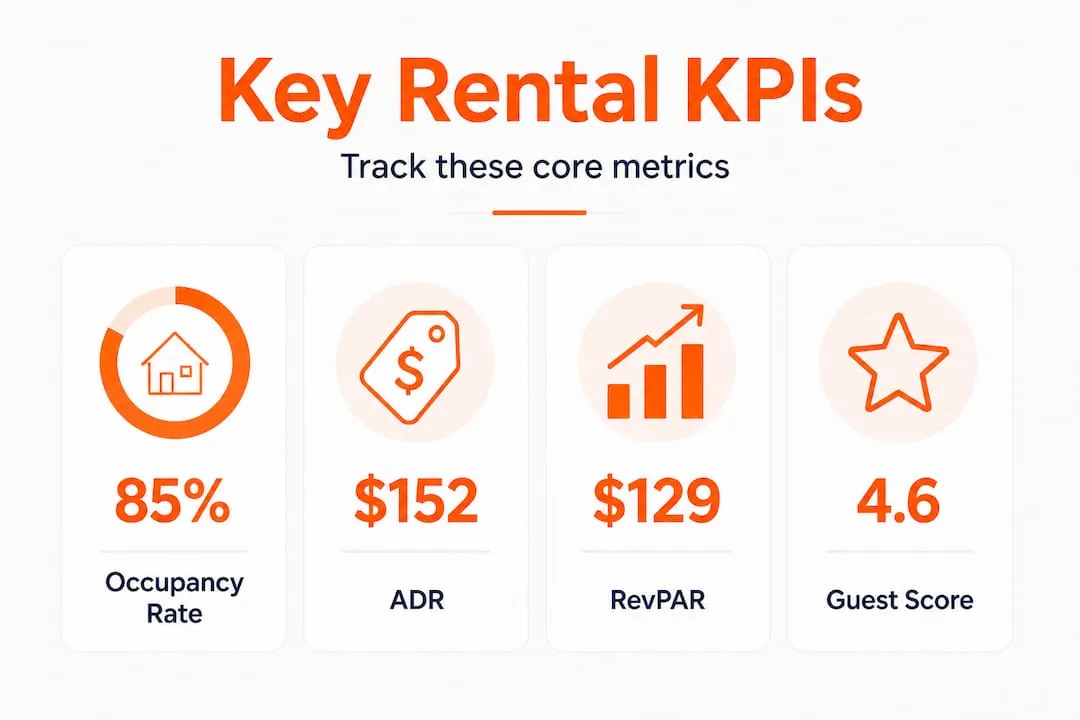
Guest satisfaction score is typically pulled from your platform ratings (Airbnb stars, Vrbo reviews). It predicts future bookings and affects search ranking more than most managers realize.
Average length of stay (ALOS) is the average number of nights per booking. Formula: Total booked nights / Number of bookings. Longer stays often mean lower cleaning costs per dollar earned, which improves net margin even if ADR stays flat.
Booking lead time measures how far in advance guests book. Short lead times may signal pricing issues or listing quality problems. Long lead times give you more revenue certainty.
Here is how the same property data looks across different metrics:
| Metric | Property A | Property B |
|---|---|---|
| Available nights | 30 | 30 |
| Booked nights | 28 | 20 |
| Occupancy rate | 93% | 67% |
| ADR | $110 | $175 |
| RevPAR | $102 | $117 |
| Total revenue | $3,080 | $3,500 |
Property A looks like the winner on occupancy. Property B wins on every revenue metric. This is the table you should show every owner who asks why you are not filling every night.
When assessing rental potential for a new property, the KPI priority order is different than for an established one.
For new properties, check in this order:
- Booking lead time (are you getting any bookings at all?)
- Occupancy rate (are guests finding and choosing your listing?)
- Guest satisfaction score (are early guests happy enough to generate reviews?)
- ADR (once bookings flow, test pricing upward)
- RevPAR (your true performance benchmark once you have 60+ days of data)
For established properties, start with RevPAR, then dig into ADR and occupancy to understand what is driving any change.
Pro Tip: KPI tracking for rentals works best when you compare your numbers to your own historical data first, then benchmark against your local market. External benchmarks are useful context, but your own trend line is the most actionable signal.
With a sense of which KPIs matter, let’s explore how to interpret them together for a smarter business snapshot.
How to interpret multiple KPIs for real insights
Raw numbers only tell part of the story. The real skill is reading KPIs in relation to each other and understanding what combinations signal about your business health.
Consider these two scenarios for the same property in the same month:
| Scenario | Occupancy | ADR | RevPAR | Monthly Revenue |
|---|---|---|---|---|
| A: High occupancy, low ADR | 90% | $120 | $108 | $3,240 |
| B: Moderate occupancy, high ADR | 65% | $185 | $120 | $3,608 |
Scenario A looks impressive on the surface. But Scenario B generates $368 more per month with 25% fewer bookings, which also means fewer turnovers, lower cleaning costs, and less wear on the property.
Pros of Scenario A (high occupancy, low ADR):
- Consistent cash flow with fewer empty nights
- More reviews generated faster, which helps new listings build credibility
- Lower risk of long vacancy gaps during shoulder seasons
Cons of Scenario A:
- Higher operational costs from more frequent turnovers
- Leaves revenue on the table during peak demand periods
- Guests may perceive low price as low quality, affecting satisfaction scores
Pros of Scenario B (moderate occupancy, high ADR):
- Higher net margin per booking after cleaning and operational costs
- Attracts guests who value the property more, often resulting in better reviews
- More pricing headroom to run targeted promotions without hurting RevPAR
Cons of Scenario B:
- More exposure to vacancy risk during slow seasons
- Requires stronger listing quality and marketing to justify premium pricing
The higher occupancy does not always mean bigger profit reality is especially important when comparing short-term and long-term rental strategies. If you are weighing your options, understanding how short and long-term rentals compare for stable income adds useful context to your KPI interpretation.
False positives are a real danger. A property running at 88% occupancy might look like a top performer in your portfolio, but if its ADR is 30% below market average, it is actually underperforming. The fix is to always calculate RevPAR and compare it to your market’s RevPAR benchmark, not just your own portfolio average.
The best KPI mix depends on your goals. If you are trying to build review volume for a new listing, prioritize occupancy temporarily. If you are managing a luxury property where owner expectations are tied to nightly rate, protect ADR even if it means accepting lower occupancy. If your goal is pure revenue growth, RevPAR is your north star.
Once you know how to view metrics together, you can turn raw data into actionable strategies for your rentals.
Turning KPI data into business decisions
Knowing your KPIs is only half the job. Acting on them is where the revenue actually moves.
Here is a step-by-step response framework for common KPI scenarios:
-
If occupancy is low (below 60% outside of known slow seasons): Review your listing photos, title, and description first. Then check your minimum stay settings. A three-night minimum during a period when most guests want one or two nights will kill your bookings. Lower the minimum temporarily and monitor lead time.
-
If ADR is low relative to your market: Pull your competitors’ pricing for the same dates. If they are charging significantly more, your listing may be undervalued or your amenities may not be communicated clearly. Improve your listing copy and test a 10% price increase on future dates that are not yet booked.
-
If RevPAR is declining despite stable occupancy: Your ADR is slipping. This often happens when dynamic pricing tools are set too aggressively toward filling nights rather than maximizing revenue. Tighten your minimum price floor.
-
If guest satisfaction scores drop: Act immediately. A drop from 4.8 to 4.6 stars on Airbnb can reduce your search visibility within weeks. Audit your last five guest communication threads and your most recent cleaning reports. The issue is almost always in one of those two areas.
-
If ALOS is very short (one to two nights on average): You may be attracting party bookings or guests who treat the property roughly. Consider raising your minimum stay, adjusting your pricing for shorter stays, or adding a damage deposit.
Running A/B tests on pricing is more straightforward than most managers think. Choose two similar properties or two comparable future date ranges. Apply different pricing strategies to each, hold all other variables constant, and compare RevPAR after 30 days. This gives you real data instead of guesswork.
Seasonal adjustments should be driven by your own historical data. Look at your occupancy and ADR by month for the past two years. Identify which months consistently underperform and pre-plan promotional strategies for those periods rather than reacting when they arrive. Essential management tips consistently point to proactive seasonal planning as one of the highest-leverage habits for property managers.
The occupancy metric used carefully with other measurements principle applies directly here: when you run a seasonal promotion, track whether the occupancy gain actually produces a RevPAR gain. If it does not, the promotion is costing you money.
Tactical changes that tend to improve multiple KPIs simultaneously:
- Upgrading photography (improves occupancy and ADR)
- Adding or highlighting premium amenities like a hot tub or fast WiFi (improves ADR and guest satisfaction)
- Streamlining check-in with smart locks (improves guest satisfaction and ALOS by removing friction)
- Responding to every review within 24 hours (improves guest satisfaction score and signals active management to platforms)
Pro Tip: Schedule a formal KPI review every month, not just when something looks wrong. Document what changed, why you think it changed, and what you plan to do about it. After six months, you will have a decision-making playbook that is specific to your portfolio and markets.
Before wrapping up, let’s address what most guides miss about the art and science of KPI mastery.
Why KPI mastery is more art than science
Here is something most KPI guides will not tell you: the formulas are the easy part. Every manager can learn to calculate RevPAR in five minutes. The hard part is knowing when to trust the number and when to question it.
We have seen properties where high occupancy achieved through discounting looked like a market success story right up until the owner realized their property was generating less net income than a neighbor running at 60% occupancy with a premium rate. The numbers were technically accurate. The interpretation was completely wrong.
Real KPI mastery means understanding your local market’s quirks. A beach town in the Southeast might have a six-week peak season where RevPAR should be maximized aggressively, followed by eight months where maintaining any occupancy is the goal. Applying the same RevPAR optimization logic year-round in that market will cost you money during shoulder seasons. You need to know when the textbook rule applies and when your market rewrites it.
It also means being willing to experiment. If your ADR has been flat for two years, something in your pricing strategy is stuck. Test a 15% price increase on a two-week window and see what happens to bookings. The worst outcome is that you learn something. The best outcome is that you discover your property was underpriced the whole time.
Exploring strategies for better returns from different portfolio structures can also reshape how you think about which KPIs to prioritize at the portfolio level versus the individual property level. A single luxury villa and a portfolio of budget units should not be managed to the same KPI targets.
The managers who consistently outperform their markets are not the ones with the most data. They are the ones who have learned to ask better questions of their data.
A smarter way to manage your rental KPIs
Understanding KPIs is one thing. Tracking them across dozens of properties, multiple booking channels, and shifting market conditions is a different challenge entirely. Manual spreadsheets break down fast when your portfolio grows, and delayed data means delayed decisions.

RealtevoOS for KPI management was built specifically for property managers who need real-time visibility across their entire operation. The platform pulls data from Airbnb, Vrbo, and other channels into a unified dashboard, so your occupancy, ADR, RevPAR, and guest satisfaction scores are always current and always in one place. AI-driven automation handles guest communication and owner reporting, freeing your team to focus on the strategic decisions that actually move your KPIs. If you are ready to stop chasing numbers in spreadsheets and start acting on insights, it is worth seeing what a purpose-built system can do for your portfolio.
Frequently asked questions
What is the most important KPI for short-term rental success?
No single metric is best. Combining occupancy, ADR, and RevPAR gives you a complete performance snapshot, since reading these metrics together rather than in isolation is the only reliable way to assess true revenue health.
How can I improve RevPAR without just raising prices?
Enhance guest experience, optimize your listing photos, and experiment with minimum stay settings to boost RevPAR alongside pricing strategies. Better reviews and stronger listing quality allow you to hold higher rates without sacrificing occupancy.
What pitfalls should I avoid when tracking KPIs?
Avoid focusing on a single KPI in isolation, since high occupancy through discounting can create a false sense of success while actually reducing your revenue. Always use multiple metrics together for an accurate picture.
How often should I review short-term rental KPIs?
Review your main KPIs at least monthly to spot trends and respond before they impact your revenue. For active portfolios in competitive markets, a weekly check on occupancy and booking lead time is even better.