How to Track Portfolio Occupancy Trends Across Listings
Discover how to effectively track portfolio occupancy trends. Centralize data and automate alerts to maximize bookings and revenue.

How to Track Portfolio Occupancy Trends Across Listings
For multi-listing managers, the most effective approach is to centralize nightly availability and bookings from every source, then track six core KPIs at multiple lookahead windows with automated alerts tied directly to pricing and operations.
Here is what to track and connect from day one:
- Occupancy rate, ADR, and RevPAR at portfolio, market, and per-listing levels
- Market Penetration Index (MPI) at 90, 60, and 30 days out to catch pacing problems before they cost revenue
- Booking lead time, length of stay (LOS), and cancellation rate to understand demand shape
- Data sources to integrate: PMS or channel manager feeds, Airbnb and Vrbo API exports, calendar ICS files, owner statements, and third-party market benchmarks
- Expected payoff: faster pricing decisions and measurable weekly time savings from automated owner reports and ops scheduling
Key Takeaways
Tracking portfolio occupancy trends requires per-listing MPI at 90/60/30-day windows, RevPAR-focused decisioning, and automated alerts tied to pricing and ops workflows built on clean, deduplicated data.
| Point | Details |
|---|---|
| Track MPI, not just occupancy | Per-listing MPI at 90/60/30 days surfaces underperformers that portfolio averages hide. |
| RevPAR beats occupancy alone | ADR × occupancy rate reveals whether you are maximizing revenue or just filling nights. |
| Clean data first | Deduplicate bookings, tag owner blocks, and normalize timezones before building any dashboard. |
| Automate with guardrails | Set owner approval windows and blackout dates before activating pricing or ops triggers. |
| Realtevoos centralizes it all | The Realtevoos Command Center connects Airbnb, Vrbo, Guesty, and Hostaway into one real-time portfolio view with built-in MPI monitoring and automated workflows. |
Table of Contents
- What are the key occupancy KPIs and how do you calculate them?
- Where does your occupancy data come from, and how do you extract it reliably?
- How should you aggregate and segment bookings into portfolio insights?
- What dashboards and reporting cadence do you need to monitor pacing?
- How do you convert occupancy signals into automated revenue and ops actions?
- How do you build reproducible calculations and manage data lag?
- What data mistakes corrupt your occupancy signals, and how do you fix them?
- Your 30/60/90-day rollout plan for portfolio occupancy tracking
- How do you benchmark your portfolio against third-party market data?
- How do predictive analytics and machine learning improve occupancy forecasting?
- What does a successful portfolio occupancy monitoring implementation look like?
- What most managers get wrong about portfolio occupancy data
- Realtevoos gives you portfolio-level occupancy intelligence from day one
- Sources
What are the key occupancy KPIs and how do you calculate them?
Tracking portfolio occupancy trends starts with precise formulas. Guessing at definitions costs you accuracy at scale.
| KPI | Formula | Quick Example |
|---|---|---|
| Occupancy Rate | Nights Booked ÷ Nights Available | 20 booked ÷ 31 available = about two-thirds |
| ADR | Total Revenue ÷ Nights Booked | $6,200 ÷ 20 nights = $310 |
| RevPAR | ADR × Occupancy Rate | $310 × 0.645 = $199.95 |
| MPI | (Listing Occupancy ÷ Market Occupancy) × 100 | Listing occupancy divided by market occupancy, multiplied by 100, equals a percentage below 90 |
| Booking Lead Time | Avg. days from booking to check-in | Sum of lead days ÷ booking count |
| LOS | Total nights stayed ÷ number of stays | 60 nights ÷ 15 stays = 4.0 nights |
| Cancellation Rate | Cancellations ÷ Total Bookings | 3 ÷ 40 = 7.5% |
RevPAR ties ADR and occupancy together into a single number that shows whether you are maximizing revenue, not just filling nights. A fully booked calendar at a depressed ADR produces a low RevPAR and signals underpricing, not success. High occupancy alone can be misleading — always read it alongside ADR and RevPAR.
Rolling averages matter because nightly occupancy is noisy. A 7-day rolling average smooths weekend spikes; a 28-day average reveals true monthly trends; a 90-day average anchors seasonal comparisons. For visualization, use line charts for pacing curves, heatmaps for calendar concentration, and bar charts to compare ADR by property type or channel.
Where does your occupancy data come from, and how do you extract it reliably?
Your canonical data sources, in priority order:
- PMS or channel manager (Guesty, Hostaway, and similar): the most complete booking record, including rates, stay dates, and guest details
- Airbnb and Vrbo API exports: direct confirmation of platform-level bookings and calendar blocks
- Calendar ICS feeds: lightweight fallback for properties not yet on a full PMS
- Owner statements and accounting feeds: reconcile revenue figures against booking totals
- Third-party market data: benchmark occupancy and ADR against comparable listings in the same market
For ETL, direct API sync is the most reliable path. Nightly batch pulls work for sources without real-time webhooks. CSV reconciliation is a last resort and should be automated, not manual. Eliminating manual spreadsheet chasing lets your team focus on revenue decisions instead of pulling numbers from multiple logins.
Data quality checklist before any data enters your dashboard:
- Deduplicate bookings that appear on both the PMS and the OTA feed
- Normalize all timestamps to a single timezone (UTC is safest)
- Tag blocked dates as owner-use, maintenance, or true availability so they do not inflate your available-nights denominator
- Retain only the guest data fields you actually need; minimize PII storage from the start
Pro Tip: Set up a real-time occupancy monitoring pipeline that flags any booking that appears in the OTA feed but not the PMS within 15 minutes — that gap is where double-counts and ghost blocks hide.
How should you aggregate and segment bookings into portfolio insights?
Portfolio averages lie. Per-listing MPI at 90, 60, and 30 days is the metric that surfaces those underperformers before the month closes.
Maintain aggregation at these levels simultaneously:
- Portfolio total for owner and investor reporting
- Market or neighborhood to compare against local benchmarks
- Property type (1–2 bedroom condos, 3–4 bedroom homes, 5+ bedroom luxury)
- Channel (Airbnb, Vrbo, direct) to evaluate platform mix and commission drag
- Owner for individual owner statements
- Per-listing for daily operational decisions
Useful cohort examples: high-demand weekend properties versus weekday-heavy urban condos; event-driven listings near stadiums versus seasonal beach homes. Each cohort needs its own MPI threshold because their natural pacing curves differ.
On sample size: treat a pacing change as significant only when it persists across at least two full booking weeks and affects more than one listing in the cohort. A single listing’s anomaly is usually a data issue or a one-off cancellation, not a market signal.
MPI alert threshold: an MPI below 85 at the 60-day window calls for immediate review. At 30 days, an MPI below 90 warrants a pricing or minimum-stay adjustment.
What dashboards and reporting cadence do you need to monitor pacing?
Real-time integrated dashboards that pull from your PMS and channel managers let you see occupancy, ADR, and booking pace as they shift. The recommended cadence: daily for pricing syncs, weekly for owner snapshots, monthly for performance reviews.
Build five dashboard tabs:
- Portfolio overview: total occupancy, ADR, RevPAR, and MPI at 90/60/30 days
- Per-market pacing: line charts showing booking curves versus prior-year and market benchmarks
- Property health grid: a color-coded table with each listing’s MPI, occupancy, and ADR status
- Booking-curve heatmap: calendar view of future availability concentration by week
- Future availability calendar: open nights by property for ops scheduling
Automate these alerts:
- MPI drops below threshold at any lookahead window
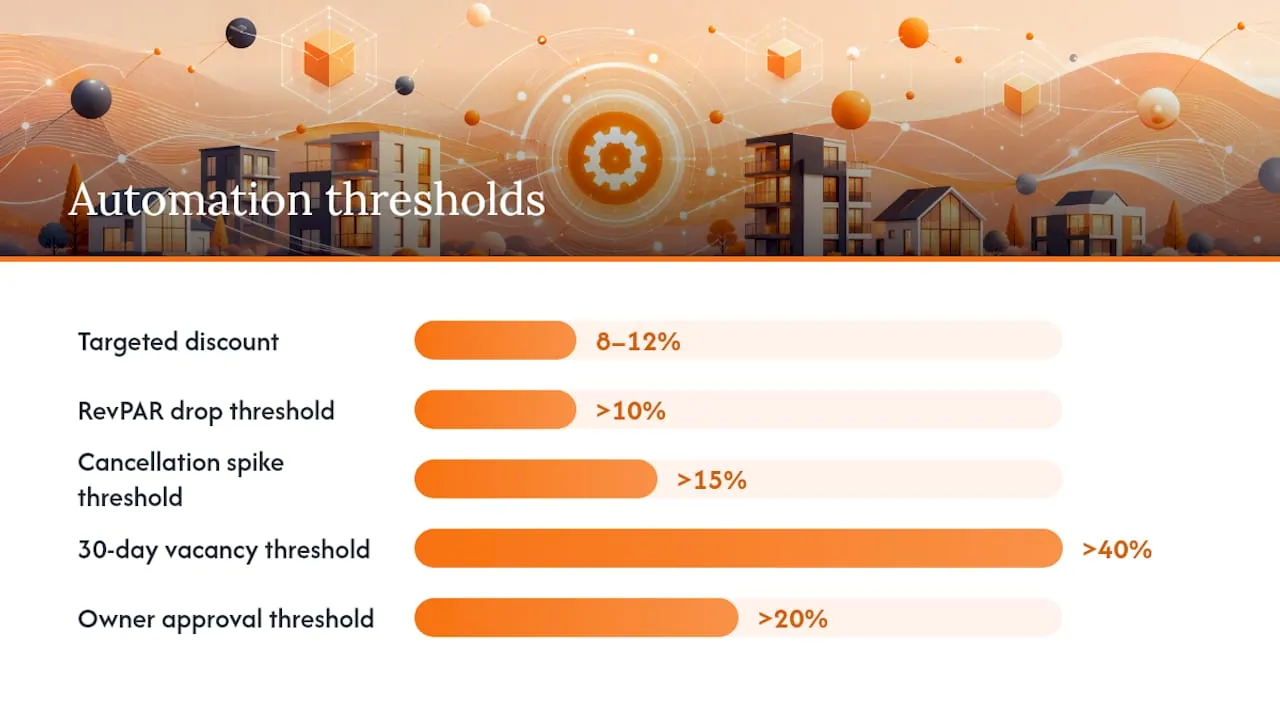
- RevPAR declines more than 10% week-over-week for a market segment
- Cancellation rate spikes above your baseline for a rolling 7-day window
- A listing goes 14 days without a new booking inside a 60-day window
Pro Tip: Weekly owner snapshots sent automatically on Monday morning, before owners call you, reduce inbound questions by a measurable margin and build trust faster than any manual report.
How do you convert occupancy signals into automated revenue and ops actions?
Signals without workflows are just noise. Map every threshold to a deterministic action:
- MPI < 85 at 60 days → flag to revenue manager → reduce minimum stay by one night → apply a targeted 8–12% discount to the next open 14-day window
- RevPAR drops >10% week-over-week → evaluate ADR versus occupancy tradeoff → if occupancy is high and ADR fell, raise rates; if occupancy fell and ADR held, reduce minimum stay
- Cancellation spike (>15% in 7 days) → audit for policy or listing issue → pause dynamic pricing changes until root cause is confirmed
- Booking confirmed → trigger cleaning/turnover schedule → notify team lead with property details and check-in time
- 30-day window opens with >40% vacancy → send owner communication with current pacing and recommended action
For revenue tips that drive real results, pair dynamic pricing triggers with minimum-stay rules rather than running them independently.
Automation guardrails matter as much as the automations themselves:
- Set owner approval windows for rate changes above a defined threshold (e.g., more than 20% below rack rate)
- Define blackout dates where no automated discounts apply (peak holidays, local events)
- Log every automated action with a timestamp and the triggering metric value for audit purposes
Pro Tip: Integrate your reservation management workflows with cleaning and turnover scheduling so a confirmed booking automatically queues the right team without a manual handoff.
How do you build reproducible calculations and manage data lag?
| Source | Recommended Refresh | Typical Lag |
|---|---|---|
| PMS (Guesty, Hostaway) | Real-time webhook | < 5 minutes |
| Airbnb API | Every 15 minutes | 5–15 minutes |
| Vrbo API | Every 30 minutes | 10–30 minutes |
| Calendar ICS | Hourly batch | 30–60 minutes |
| Market benchmark data | Nightly batch | 12–24 hours |
| Owner statements | Weekly batch | 1–7 days |
Sample pseudocode for nightly occupancy rate per listing:
FOR each listing IN portfolio:
  available_nights = COUNT(calendar_days WHERE status != 'owner_block')
  booked_nights = COUNT(bookings WHERE status = 'confirmed' AND NOT cancelled)
  occupancy_rate = booked_nights / available_nights
For MPI at a lookahead window:
listing_occ_30d = booked_nights_next_30 / available_nights_next_30
market_occ_30d = AVG(listing_occ_30d) FOR all listings IN same_market
MPI_30d = (listing_occ_30d / market_occ_30d) * 100
The Realtevoos Command Center handles these calculations and integrations natively, connecting Airbnb, Vrbo, Guesty, and Hostaway feeds into a single portfolio view.
Reconciliation checklist to run nightly:
- Compare PMS booking count to OTA API booking count — flag any gap above 2%
- Verify available-nights denominator excludes all owner-block and maintenance dates
- Confirm ADR calculation uses net revenue (after OTA fees) not gross booking value
- Check that timezone normalization produced no duplicate check-in dates
What data mistakes corrupt your occupancy signals, and how do you fix them?
The most common errors, and their fixes:
- Double-counting bookings: a reservation appears in both the PMS and the OTA feed. Fix: assign a canonical booking ID from the PMS and deduplicate on that key before aggregation.
- Owner blocks counted as sold nights: personal-use blocks inflate occupancy. Fix: tag all owner-block calendar entries at ingestion and exclude them from the booked-nights numerator.
- Timezone mismatches: a check-in at 11 PM local time logs as the next day in UTC, creating phantom availability gaps. Fix: store all timestamps in UTC and convert to local time only at the display layer.
- Late cancellations mis-tagged as completed stays: this inflates occupancy and ADR. Fix: apply a post-stay status reconciliation job that checks OTA cancellation records against PMS stay records within 48 hours of checkout.
When you see a sudden occupancy spike or drop, check the data pipeline before assuming it is a market signal. A spike often means a batch job ran twice; a drop often means a feed went silent.
On privacy: store only the guest fields your operations require (name, check-in date, contact for messaging). Do not retain payment card data or passport numbers beyond the stay. Minimal PII retention reduces both compliance risk and breach exposure.
Pro Tip: *Add a row-count validation to every nightly ETL job.
Your 30/60/90-day rollout plan for portfolio occupancy tracking
Days 1–30: Data audit and quick wins
- Inventory every data source: PMS, OTAs, ICS feeds, owner statements
- Connect PMS and channel manager via API; set refresh cadence per the table above
- Implement dedupe rules and timezone normalization
- Build a basic portfolio overview dashboard with occupancy rate, ADR, and RevPAR
- Define metric owners: who reviews pricing daily, who sends owner reports weekly
Days 31–60: MPI monitoring and segmentation
- Add per-listing MPI at 90/60/30-day windows to the dashboard
- Build market and property-type cohorts; set MPI alert thresholds
- Launch weekly owner snapshot automation
- Run first monthly performance review and document baseline KPIs
Days 61–90: Workflow automation and scale
- Activate pricing trigger automations with guardrails (owner approval windows, blackout dates)
- Connect cleaning and turnover scheduling to booking confirmation events
- Pilot the full workflow in one market before rolling portfolio-wide
- Measure: daily reconciliations accurate, manual reporting hours reduced, MPI alerts firing correctly
Minimum success criteria: zero unreconciled booking discrepancies at 30 days; MPI monitoring live for all listings at 60 days; automated owner reports replacing manual ones at 90 days. The occupancy optimization strategy guide covers additional sequencing for managers scaling beyond 50 properties.
How do you benchmark your portfolio against third-party market data?
Third-party market data gives your MPI calculations meaning. Without an external benchmark, MPI is just a ratio of your own listings against each other.
Best practices for integration:
- Pull market-level occupancy and ADR from data providers that cover your specific submarkets, not just metro-level averages
- Align the benchmark’s available-nights definition with your own (some providers exclude owner blocks; others do not)
- Refresh market benchmarks on a nightly basis and store them with a date key so you can compare current pacing to the same week in prior years
- Use benchmarks to set MPI thresholds by property type: a 1–2 bedroom condo in a beach market has a different natural pacing curve than a 5-bedroom mountain cabin
- Flag any benchmark data that lags more than 48 hours; stale benchmarks produce misleading MPI values
Treat market data as a signal layer, not a source of truth. Your PMS data is the source of truth; market data tells you whether your performance is a portfolio problem or a market-wide condition.
How do predictive analytics and machine learning improve occupancy forecasting?
Descriptive dashboards tell you what happened. Predictive models tell you what to do before it happens.
Practical ML applications for vacation-rental portfolios:
- Demand forecasting: train a time-series model (ARIMA, Prophet, or gradient boosting) on 24+ months of booking data, incorporating local events, school calendars, and prior-year pacing to project occupancy at 90/60/30 days
- Cancellation prediction: a classification model on booking attributes (lead time, LOS, channel, guest history) can flag high-cancellation-risk reservations so you can adjust overbooking buffers or require stricter policies
- Dynamic pricing optimization: reinforcement learning models adjust rates in real time based on current MPI, competitor pricing signals, and remaining availability
- Anomaly detection: unsupervised models identify booking-curve deviations that fall outside historical norms, triggering alerts before a human would notice the pattern
The practical floor for training a reliable demand model is 18–24 months of clean, deduplicated booking data across at least 10 comparable listings. Below that threshold, statistical benchmarking against market data is more reliable than a bespoke model.
What does a successful portfolio occupancy monitoring implementation look like?
Two scenarios illustrate what the methodology produces in practice.
Scenario A: Mid-size management company, 35 listings across two beach markets. Before centralizing data, the team ran weekly occupancy reports manually from three separate OTA dashboards and a spreadsheet. After connecting their PMS to a unified portfolio dashboard with MPI monitoring at 60 and 30 days, they identified four listings consistently running MPI below 80 at the 60-day mark. Adjusting minimum stays from three nights to two nights on those properties, combined with targeted rate reductions in the 45–60-day booking window, moved their MPI above 90 within six weeks. Owner reporting shifted from a four-hour weekly task to an automated Monday morning email.

Segmenting by property type and applying separate MPI thresholds per cohort revealed the problem. Automated pricing triggers for the cabin cohort, set to activate when MPI dropped below 85 at 90 days, reduced shoulder-season vacancy by filling gaps that previously went unnoticed until it was too late to adjust rates effectively.
Both scenarios share the same foundation: clean data, per-listing MPI tracking, and automated alerts tied to specific operational responses.
What most managers get wrong about portfolio occupancy data
The conventional wisdom says to track occupancy rate and you know how your portfolio is performing. That is wrong, and it costs managers real revenue every month.
It is an average. The metric that actually tells you where to act is MPI at multiple lookahead windows, segmented by property type and market. That is the difference between a manager who reacts to last month’s numbers and one who adjusts pricing six weeks before the gap opens.
The second mistake is treating automation as a replacement for judgment. Automated alerts and pricing triggers work when they are built on clean, deduplicated data with clear guardrails. When the data pipeline has timezone errors or owner blocks counted as sold nights, automation amplifies the mistake at scale. The methodology in this guide, specifically the reconciliation checklist and the ETL validation rules, exists because the automation is only as reliable as the data feeding it.
The third mistake is skipping the per-market segmentation step and going straight to portfolio-wide automation. Pilot in one market first. Confirm the MPI thresholds make sense for that market’s pacing curve. Then scale. Managers who skip the pilot phase often end up with pricing rules that work for their beach properties and actively harm their urban condos.
Realtevoos gives you portfolio-level occupancy intelligence from day one
Managing 20, 50, or 100+ listings without a unified data layer means your team spends hours every week pulling numbers that should already be in front of them. Realtevoos eliminates that gap. The Realtevoos Command Center connects your Airbnb, Vrbo, Guesty, and Hostaway feeds into a single portfolio dashboard with real-time occupancy, ADR, RevPAR, and MPI monitoring at 90/60/30-day windows, all without manual exports.

Automated owner reports go out on your schedule. Pricing triggers fire when MPI crosses your defined thresholds. Cleaning and turnover scheduling connects directly to booking confirmations. Property managers using Realtevoos report saving several hours each week previously spent on manual reporting, time that goes back into revenue decisions and owner relationships. Start with a 30-day data audit and a single-market pilot: connect your PMS, validate your dedupe rules, and let the dashboard show you where your portfolio actually stands. Schedule a demo to see the Command Center with your own property data.
Sources
- RevPAR, ADR & Occupancy Rate Explained for Vacation Rental Owners
- Data-Driven Vacation Rental Management: Real-Time Reporting