Machine Learning Demand Forecasting for Rentals in 2026
Unlock accurate demand forecasting for rentals with machine learning. Reduce errors and boost efficiency in just 8–12 weeks.

Machine Learning Demand Forecasting for Rentals in 2026
Adopt a demand-aware machine learning forecasting approach that blends historical bookings, live intent signals, and local external drivers, then wire the output directly into your pricing engine and ops workflows. That is the short answer. The longer answer is a pilot-to-production path that any rental team can run in 8–12 weeks.
Here is what the evidence supports before you read further:
- IBM industry reporting finds AI forecasting can substantially reduce demand prediction errors and significantly shorten forecast preparation time.
- A hybrid model study published in MDPI Applied Sciences achieved an average forecasting error of just 3.06% by pairing historical booking data with external drivers like weather and events.
- The RentOptima vehicle rental framework produced an LSTM model with R² ≈ 0.93, outperforming ARIMA and Prophet on fleet-level accuracy.
- Immediate next step: run a 2–6 week forecast horizon pilot on a representative subset of your properties or equipment categories using clean CSV exports before committing to full API integration.
- Recommended platform: Realtevoos centralizes PMS data, live intent signals, and pricing automation in one place, making it the most practical starting point for vacation rental managers.
Key Takeaways
Machine learning demand forecasting for rentals delivers its highest ROI when forecasts are wired directly into pricing engines and operational workflows, not treated as standalone analytics outputs.
| Point | Details |
|---|---|
| Start with a data audit | Pull 2–3 seasons of PMS history, flag closures and cancellations, and clean before modeling. |
| Pilot on a small subset first | Run a 2–6 week forecast horizon on 1–3 property groups before scaling or automating pricing. |
| Match model to data volume | Use Holt-Winters for low-volume portfolios; XGBoost or hybrid ensembles when external covariates are available. |
| Measure both accuracy and business KPIs | Track MAE/MAPE alongside occupancy, RevPAR, and denied bookings to confirm operational impact. |
| Realtevoos for integrated deployment | Realtevoos connects PMS data, live intent signals, and dynamic pricing in one platform, supporting CSV pilots and full API integration. |
Table of Contents
- Why machine learning demand forecasting changes rental operations
- What machine learning demand forecasting for rentals actually does
- What data and features should you feed into rental ML models?
- Which models work best for rental demand forecasting?
- How to implement ML forecasting in your rental operation
- How forecasts should feed pricing and operational workflows
- How do you know if your forecasts are actually working?
- Common failure modes and how to avoid them
- Research evidence and real-world impact
- How Realtevoos implements ML forecasting for vacation rental managers
- An operations-first perspective on adopting ML forecasting
- Realtevoos gives you a faster path from pilot to production
- Sources
Why machine learning demand forecasting changes rental operations
Most rental managers already track occupancy. The gap is in anticipating it. Traditional forecasting tools look backward. Machine learning demand forecasting for rentals looks forward, and the difference shows up directly in revenue and utilization.
Better forecasts feed dynamic pricing engines with demand signals rather than just competitor rate scrapes. That is a fundamentally different posture than reacting to a competitor’s price change after the fact.
On the operational side, the gains compound. Staffing rosters, maintenance windows, and fleet redistribution all benefit from a 2–4 week demand view. A maintenance window placed in a predicted low-demand trough avoids pulling a unit offline during a high-revenue stretch.

AI-driven automation for rental managers consistently shows that the biggest gains come not from the forecast itself but from connecting it to downstream decisions. Occupancy, RevPAR, and average daily rate (ADR) all improve when forecasts drive action rather than sit in a spreadsheet.
Pro Tip: There is a meaningful difference between a “price-aware” system (one that watches competitor rates) and a “demand-aware” system (one that reads booking velocity, lead volume, and intent signals). Demand-aware systems produce larger operational gains because they surface the signal before it shows up in pricing data.
📊 Statistic: IBM reports that AI forecasting can reduce demand prediction errors by 20%–50% and cut preparation time from over 80 hours to under 15 hours per cycle.
What machine learning demand forecasting for rentals actually does
The industry term is probabilistic demand forecasting, and it refers to an automated, data-driven prediction process that weights historical bookings and external covariates to output a demand estimate by unit, category, and day, along with a confidence range.
Traditional statistical methods like simple moving averages or manual seasonal adjustments handle one or two variables at a time. ML models handle dozens simultaneously and capture non-linear relationships, such as how a prolonged heatwave predicts a booking surge two weeks later, that rule-based systems miss entirely. They also retrain continuously as new data arrives, so the model stays current without manual recalibration.
The forecast pipeline for a rental operation runs in five stages:
- Data ingestion: PMS records, channel logs, rate history, and external feeds flow into a central data store.
- Feature engineering: raw data is transformed into model inputs (lead time, day-of-week, event proximity, weather delta, prior-year occupancy for the same window).
- Model training: the algorithm learns demand patterns from historical labeled examples.
- Forecast generation: the trained model outputs predicted demand by unit or category for a defined horizon (typically 2–90 days).
- Operational actions: the forecast triggers pricing suggestions, staffing alerts, maintenance scheduling, and fleet redistribution.
The RIT thesis on rental property demand prediction illustrates how feature engineering choices at step two directly determine forecast quality downstream, making data preparation the highest-leverage activity in the entire pipeline.
What data and features should you feed into rental ML models?
The quality of your forecast ceiling is set by the quality of your input data. Here is what to collect and how to structure it.
Primary internal sources:
- PMS and booking records: check-in/check-out dates, lead time (days between booking and arrival), length of stay, cancellations, no-shows, and channel source.
- Rate history and availability status by unit and date.
- Channel and platform logs (Airbnb, Vrbo, direct) for booking velocity and conversion rates.
Live intent signals:
- Web lead volume, chat inquiries, and phone call logs.
- Abandoned checkout activity and search query trends.
- Booking velocity in the 7–14 days before a target date.
Some commercial occupancy forecasting tools fuse live prospect intent with PMS unit-status to generate 30–90 day occupancy projections, which shows how much signal lives in pre-booking behavior rather than confirmed reservations alone.
External covariates:
- Weather forecasts (temperature, precipitation, storm risk).
- Local event calendars: concerts, sports events, conventions, school holidays.
- Regional tourism indicators and local occupancy benchmarks.
Asset and unit attributes:
- Unit type, bedroom count, amenities, proximity to demand generators (beach, ski lift, convention center).
- Seasonal availability windows and current maintenance status.
Data-quality checklist before modeling:
- At minimum, two full seasons of historical booking data (three is better for capturing year-over-year drift).
- Flag and exclude forced closures, renovation periods, and policy-change windows from training labels.
- Deduplicate channel records and reconcile cancellation timestamps.
- Handle missing days with explicit “unavailable” flags rather than zeros, which a model will misread as zero demand.
Centralizing rental data across multiple properties before modeling is the single most time-consuming step, but it pays back in model accuracy and pilot speed.
Which models work best for rental demand forecasting?
Model selection comes down to three factors: how much data you have, how complex your seasonality is, and how much you need to explain the output to stakeholders.
Statistical models (Holt-Winters, ARIMA) Best for low-volume portfolios or single-location problems with clear seasonal patterns. Holt-Winters produced the lowest MAE (29.36), MSE (1,183), and MAPE (14%) in a car-rental demand forecasting study when segmentation features were applied. Fast to train, easy to explain, but limited in how many covariates they can absorb.
Tree-based and gradient boosting models (XGBoost, LightGBM) The workhorse for medium-to-large tabular datasets. Handle dozens of features well, produce feature importance scores that explain which drivers matter most, and train quickly. Prone to overfitting on small datasets without careful regularization.
Sequence models (LSTM) Best when temporal dependencies and multi-location coupling matter. The RentOptima study found an LSTM model achieved R² ≈ 0.93, outperforming ARIMA and Prophet on fleet-level vehicle rental forecasting. Higher data requirements and longer training cycles than tree-based models.
Hybrid ensembles Combine a time-series backbone with external covariate layers. The MDPI Applied Sciences hybrid study achieved a 3.06% average forecasting error by pairing historical bookings with weather, events, and economic indicators. This is the target architecture for most multi-property rental portfolios with access to external data feeds.
Explainable ML methods using public data can maintain high predictive performance while keeping models interpretable enough for pricing decisions, which matters when you need stakeholder buy-in.
| Dimension | Holt-Winters / ARIMA | XGBoost / LightGBM | LSTM | Hybrid Ensemble |
|---|---|---|---|---|
| Data requirements | Low (1–2 seasons) | Medium (2–3 seasons + features) | High (3+ seasons, multi-unit) | High (3+ seasons + external feeds) |
| Typical error range | MAPE ~14% (benchmark) | MAPE 8%–15% (varies by features) | R² up to 0.93 in vehicle rental | Error as low as 3.06% with external drivers |
| Real-time signal support | Limited | Moderate (retrain on schedule) | Moderate | Strong (designed for covariate ingestion) |
| Ease of PMS integration | High | High | Moderate | Moderate |
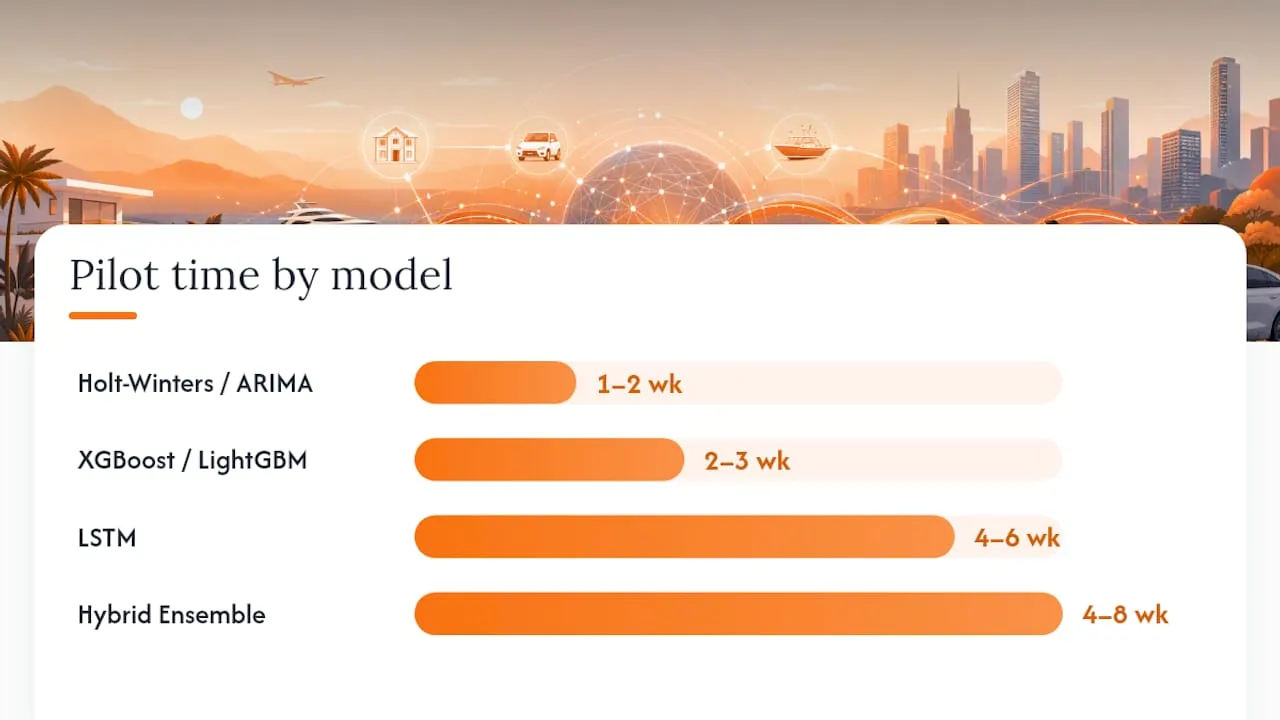
| Time to pilot | 1–2 weeks | 2–3 weeks | 4–6 weeks | 4–8 weeks |
| Cost shape | Low | Low-medium | Medium-high | Medium-high |
How to implement ML forecasting in your rental operation
A phased approach prevents the two most common failure modes: building a model no one trusts and deploying automation before the data is clean.
- Data audit (weeks 1–3): Pull 2–3 seasons of PMS exports, rate history, and channel logs. Identify gaps, forced-closure periods, and duplicate records. Document your unit taxonomy and attribute fields.
- Baseline modeling on CSV (weeks 2–4): Build a simple Holt-Winters or XGBoost model on clean CSV data. This establishes a performance baseline and surfaces data quality issues before you invest in integration.
- Pilot on 1–3 property groups (weeks 4–8): Select a representative subset covering your most common unit types. Run a 2–6 week forecast horizon. Measure MAE and MAPE against actuals daily.
- Evaluate and backtest (weeks 6–8): Use a proper time-series train/test split. Backtest against at least one high-demand event period and one low-demand trough. Confirm the model does not leak future data into training features.
- Integrate with pricing and ops (weeks 8–12): Connect the forecast output to your pricing rules engine and ops alert system. Start with rate suggestions that require human approval before automating.
- Scale and automate: Once trust is established across the pilot group, expand to the full portfolio and reduce the human approval window for low-risk rate changes.
Roles to assign before you start:
- Data owner: responsible for PMS export quality and external feed contracts.
- Analyst or data scientist: builds and validates models.
- Ops lead: translates forecast outputs into staffing and maintenance decisions.
- Pricing owner: manages rate rules and approval thresholds.
- Executive sponsor: clears blockers and owns the business case.
Pro Tip: Start with clean CSV exports if full API integration is a blocker. Automation without trust gets overridden by ops staff and dies quietly.
How forecasts should feed pricing and operational workflows
A forecast output is only valuable when it changes a decision. The integration flow looks like this:
- Forecast → confidence intervals: the model outputs a point estimate and a range (e.g., 78%–92% occupancy for a given week). Narrow intervals justify automated action; wide intervals trigger human review.
- Confidence intervals → pricing rules engine: the engine maps demand bands to rate adjustments. High-confidence high-demand forecasts lift rates; high-confidence low-demand forecasts trigger promotional rates or minimum-stay relaxation.
- Pricing engine → rate suggestions: suggestions surface in the PMS dashboard with a one-click apply or a scheduled push to connected channels.
- Forecast → ops alerts: a two-week high-demand forecast triggers a staffing roster change, a cleaning crew pre-booking, and selective fleet redistribution for equipment rental portfolios.
Guardrails to build in from day one:
- Set confidence thresholds below which no automated rate change fires.
- Define human approval windows for changes above a set percentage.
- Add blackout rules for owner-blocked dates, active promotions, and contractual rate floors.
- Throttle rules prevent daily price churn that confuses guests and channel algorithms.
Sync cadence matters. A forecast that updates every 48 hours but your PMS pulls availability every 6 hours creates a stale-signal problem. Real-time occupancy tracking with live PMS sync closes that gap. For equipment rental portfolios, predictive maintenance scheduling tied to low-demand windows keeps utilization high without pulling revenue-generating assets offline at the wrong time.
How do you know if your forecasts are actually working?
Forecast accuracy metrics and business KPIs are two different things, and you need both.
Forecast accuracy metrics:
- MAE (Mean Absolute Error): average absolute difference between predicted and actual demand. Easy to interpret in operational units (e.g., 2.3 bookings off per day).
- MAPE (Mean Absolute Percentage Error): percentage version of MAE. Useful for comparing across unit types with different demand volumes.
- RMSE (Root Mean Square Error): penalizes large errors more heavily than MAE. Use it when a single badly wrong forecast (e.g., missing a peak weekend) has outsized revenue impact.
- R²: proportion of demand variance explained by the model. The RentOptima LSTM achieved R² ≈ 0.93, a strong benchmark for fleet-level forecasting.
Business KPIs to track alongside accuracy:
- Occupancy rate and utilization by unit type.
- RevPAR and ADR trends before and after forecast-driven pricing.
- Days with denied bookings or stockouts (a sign the model under-forecasted demand).
- Revenue per unit per month compared to the pre-ML baseline.
Monitoring occupancy rates with structured tracking gives you the operational baseline to measure forecast-driven improvements against.
Backtesting checklist:
- Use a time-series split, not a random split. Future data must never appear in the training window.
- Run rolling-origin evaluation: train on months 1–12, test on month 13; train on 1–13, test on 14; and so on.
- Hold out at least one major event period for out-of-sample validation.
- Set automated drift alerts that fire when live MAPE exceeds your pilot baseline by more than a defined threshold.
📊 Statistic: A hybrid model combining historical bookings with external drivers achieved a 3.06% average forecasting error, setting a practical performance target for well-configured rental forecasting systems.
Common failure modes and how to avoid them
Most ML forecasting projects fail in production for reasons that have nothing to do with the algorithm.
Data quality traps:
- Training data that includes manually corrected bookings without flags will teach the model to expect human intervention, not real demand.
- Unhandled cancellations and no-shows inflate apparent demand in the training set.
- Sudden channel policy changes (e.g., a new minimum-stay rule on Airbnb) create structural breaks the model reads as a demand shift.
- Missing closure periods show up as zero demand, which the model treats as a real signal.
Modeling traps:
- Label leakage: using features that are only available after the booking event (e.g., final revenue) as training inputs. The model looks brilliant in backtesting and fails immediately in production.
- Overfitting to a single high-demand season. A model trained on one exceptional summer will over-forecast every subsequent summer.
- Opaque models with no feature importance output make it impossible to explain a rate recommendation to an owner or ops manager.
Operational traps:
- Auto-pricing loops that pound rates down in sustained low demand, triggering a race to the bottom that is hard to reverse.
- Over-reliance on the model without a revert plan. If the forecast engine goes offline or produces anomalous outputs, ops staff need a documented fallback.
Pro Tip: Keep a human-in-the-loop approval step for the first 60 days of automated pricing. It slows things down slightly, but it catches edge cases the model has never seen and builds the team confidence that makes full automation sustainable.
Research evidence and real-world impact
The evidence base for ML demand forecasting in rental contexts is growing fast.
The RentOptima vehicle rental framework is the most complete published example. Its LSTM model achieved R² ≈ 0.93 and reduced RMSE compared with ARIMA and Prophet, with the combined forecasting-plus-optimization system improving branch-level fleet alignment and maintenance scheduling. That is a production-grade result, not a lab benchmark.
The MDPI hybrid model study shows what happens when you add external drivers.
The car-rental segmentation study adds a useful counterpoint: Holt-Winters, a statistical model, produced the lowest MAE (29.36) and MAPE (14%) in its benchmark when segmentation features were applied correctly. The lesson is that model sophistication matters less than feature quality and proper segmentation.
📊 Statistic: IBM’s industry analysis documents AI forecasting cutting preparation time from over 80 hours to under 15 hours per cycle, a reduction that frees analyst capacity for higher-value scenario planning.
Practitioners applying forecasting to hospitality supply chains report similar patterns: the biggest gains come from connecting forecast outputs to procurement and staffing decisions, not from the forecast accuracy number alone.
How Realtevoos implements ML forecasting for vacation rental managers
Realtevoos is built as an AI-powered command center for vacation rental property managers, and its architecture maps directly onto the implementation steps described above.
Data ingestion and integration:
- Native integrations with Airbnb, Vrbo, Guesty, and Hostaway pull booking records, rate history, and availability status automatically.
- API connections and CSV import paths support both full-integration and pilot-mode deployments.
- Real-time intent signal capture from lead pipelines and guest communication logs feeds the demand signal layer.
Forecasting and pricing automation:
- The forecasting engine processes PMS data alongside external covariates to generate demand projections by property and date range.
- Dynamic pricing connectors surface rate suggestions with configurable approval thresholds, so managers control how much automation runs unsupervised.
- Owner and maintenance reporting pulls forecast data to schedule turnover and maintenance windows in predicted low-demand periods.
Operational workflow integration:
- Automated guest messaging, cleaning and turnover management, and team coordination all trigger from the same demand signal layer that drives pricing.
- DocuSign document handling and expense extraction run alongside the operational alerts, keeping the full workflow in one place.
| Requirement dimension | Realtevoos capability |
|---|---|
| Data requirements | PMS, channel, and intent signal ingestion via API or CSV |
| Forecast accuracy | Hybrid demand model with external covariate support |
| Real-time signal support | Live lead, chat, and booking velocity signals |
| Ease of PMS/channel integration | Native Airbnb, Vrbo, Guesty, Hostaway connectors |
| Time to pilot | CSV-based proof-of-concept available from onboarding |
| Cost shape | Monthly subscription, scales by property count |
An operations-first perspective on adopting ML forecasting
The biggest mistake rental teams make with ML forecasting is treating it as a technology project rather than an operations project. The algorithm is the easy part. The hard part is getting your ops staff to trust a number a model produced and act on it before the evidence is obvious to everyone.
Here is the sequence that actually works:
Days 1–30: Run the data audit. Pull your PMS history, flag the gaps, and build a simple baseline model on CSV. Do not touch pricing automation yet. Show the ops team the forecast versus actuals for the past 90 days and let them poke holes in it. Their skepticism is your quality control.

Days 31–60: Expand the pilot to your top-performing property group. Connect the forecast to a rate suggestion dashboard, but keep human approval on every change. Track MAE and MAPE weekly. When the model calls a high-demand weekend three weeks out and it materializes, that is the moment trust shifts.
Days 61–90: Automate low-risk rate suggestions (changes below a defined percentage threshold, outside blackout windows). Brief your ops staff and owners on what the system does and does not control. Document the revert plan. Review the AI trends shaping rental management in 2026 to calibrate where automation is heading and what to build toward.
The teams that succeed with ML forecasting are not the ones with the most sophisticated models. They are the ones who built internal trust fast enough to let the automation run.
Realtevoos gives you a faster path from pilot to production
Most rental managers spend weeks just getting their data into a format a model can use. Realtevoos eliminates that bottleneck. Your PMS data, channel logs, and live intent signals are already flowing into the platform, which means your management deck is ready to run a demand forecast pilot on a subset of properties from day one.

The pilot path is straightforward: connect your existing PMS or upload a CSV export, define your property subset, and let the forecasting engine generate a 2–6 week demand view alongside dynamic pricing suggestions. No months-long integration project. No separate data warehouse. The same platform that handles your guest messaging, maintenance scheduling, and owner reporting also drives your pricing intelligence.
Request a demo at Realtevoos to see the forecasting and pricing modules in action on a live property set.
Sources
- What is AI demand forecasting? | IBM
- Hybrid forecasting study — MDPI Applied Sciences
- Rental Property Demand and Supply Analysis Using Machine Learning — RIT thesis