Optimize rental revenue with analytics and automation
Discover how to optimize rental revenue using analytics and automation. Boost earnings with data-driven strategies that deliver results!

Optimize rental revenue with analytics and automation
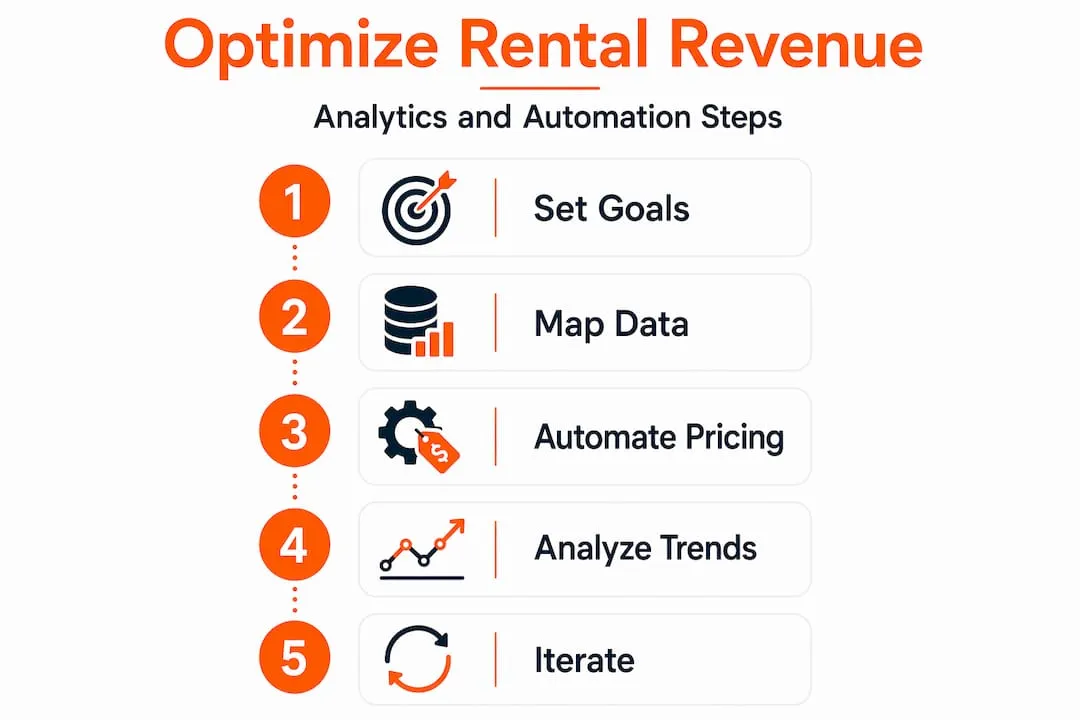
Stagnant revenue is one of the most frustrating signals a rental operator can receive, especially when the calendar shows strong demand but earnings stay flat. Relying on fixed rates or gut instinct in a market that moves by the hour leaves real money on the table. Property managers who implement automated insights and data-driven decision-making consistently outperform those who don’t, and the gap is widening. This article walks you through a proven, step-by-step approach to optimize your rental revenue using predictive analytics, dynamic pricing, and intelligent automation so you can scale confidently and profitably.
Table of Contents
- Define your goals and map your data
- Implement automated dynamic pricing for maximum revenue
- Leverage predictive analytics for proactive management
- Avoid common mistakes: Overpricing, data paralysis, and healthy KPIs
- Verify results and iterate for sustainable growth
- The missing piece: Why data maturity beats volume, and what experts won’t tell you
- Next steps: Unlock your revenue potential with purpose-built tools
- Frequently asked questions
Key Takeaways
| Point | Details |
|---|---|
| Automate pricing adjustments | AI-driven tools let you set real-time rates and boost rental revenue by up to 40%. |
| Focus on the right metrics | Tracking RevPAR, NOI, and guest satisfaction helps you measure what matters. |
| Leverage predictive analytics | Use data trends and machine learning to anticipate demand and maximize occupancy. |
| Avoid common mistakes | Don’t let overpricing or too much data reduce profits—balance rates and data quality. |
| Iterate for lasting growth | Continuous review and adjustment sustains revenue increases over time. |
Define your goals and map your data
Before any tool or algorithm can help you, you need clarity on what you’re optimizing for. Many operators skip this step and end up drowning in dashboards without knowing what they’re measuring. Start by identifying your core performance metrics.
The four numbers that matter most are:
- RevPAR (Revenue Per Available Room): Combines occupancy and rate into one profitability signal.
- NOI (Net Operating Income): Your revenue minus operating costs, the clearest picture of actual profitability.
- ADR (Average Daily Rate): The average revenue earned per occupied rental night.
- Occupancy rate: The percentage of available nights that are actually booked.
These aren’t just reporting numbers. They’re decision-making levers. Once you know your current RevPAR and how it compares to your market, you have a clear target to optimize against.
Next, build a basic data map. List every source that touches your revenue: Airbnb, Vrbo, direct booking sites, your property management system, guest reviews, and even local event calendars. For each source, note how often data updates, whether it flows automatically or requires manual export, and how reliable it is. Data quality issues compound quickly across a portfolio of 20 or more properties.
A useful frame here comes from dynamic pricing strategies that highlight how inconsistent data inputs create pricing blind spots. Similarly, understanding your cost structure is foundational: operators who apply cost control for vacation rentals alongside revenue strategies consistently see better NOI results.
Industry benchmarks vary by market, but a general rule is that top-performing short-term rental operators maintain occupancy above 75% while keeping ADR within 15% of their comp set. If you’re outside those ranges, you have a clear optimization problem to solve.
Pro Tip: Start with the cleanest, most continuous data you have, even if it’s from just one channel. A small, accurate dataset beats a large, messy one every time when you’re feeding it into analytics tools.
Manual tracking vs. automated platforms: a quick comparison
| Factor | Manual tracking | Automated platform |
|---|---|---|
| Data freshness | Hours to days | Real-time |
| Error rate | High (human input) | Low (automated sync) |
| Scalability | Breaks at 10+ units | Scales to 100+ units |
| Insight depth | Surface-level | Predictive and segmented |
| Time cost | 10-20 hrs/week | 1-3 hrs/week |
| Response to market shifts | Delayed | Immediate |
The case for automated pricing tools becomes obvious when you see how much manual tracking costs in both time and missed opportunities.
With clear goals and the right data foundation, you can now move to the next layer: turning information into revenue through automated tools.
Implement automated dynamic pricing for maximum revenue
Dynamic pricing is the practice of adjusting your nightly rates in real time based on demand signals, competitor rates, local events, seasonal patterns, and booking pace. It sounds complex, but modern tools make the setup process manageable.
Here’s a practical step-by-step approach:
- Choose your pricing software. Look for platforms that pull data from your primary channels and offer market-level competitor tracking.
- Integrate your data feeds. Connect your property management system and all booking channels. The tool needs live occupancy data to function accurately.
- Set your pricing parameters. Define a minimum rate (your floor, based on costs) and a maximum rate (your ceiling, based on what the market will bear). Never leave these open-ended.
- Configure event and seasonal rules. Input local event calendars and major holiday windows. These should trigger automatic rate adjustments before demand peaks.
- Review and refine weekly. In the first 60 days, check how the system performs against your RevPAR target. Adjust parameters based on actual booking behavior.
The data on revenue impact is compelling. Dynamic pricing strategies using automated tools and AI increase rental revenue by 7 to 40% through real-time adjustments based on demand, competitor rates, and local events. The range is wide because it depends on your starting point, market competitiveness, and how well you configure the system. Properties moving off flat monthly rates typically see the highest early gains.
Revenue uplift ranges by strategy type

| Strategy | Typical revenue uplift | Best for |
|---|---|---|
| Basic seasonal pricing | 7-12% | Single-market operators |
| Competitor-aware dynamic pricing | 12-22% | Multi-property portfolios |
| AI-driven demand forecasting | 22-40% | High-volume, multi-market operators |
| Combined dynamic + predictive | 30-40%+ | Enterprise-scale operators |
The combination of AI-powered rental automation and smart pricing parameters is what separates operators who hit the top of that range from those who stay at the bottom.
Pro Tip: Always set a minimum rate that covers your fully loaded cost per night, including cleaning, utilities, platform fees, and management overhead. Pricing below cost even for one night to fill occupancy is a margin trap.
Reviewing dynamic pricing competitors in your market helps you calibrate where you sit relative to alternatives and how aggressively you can price during high-demand windows.
After automating pricing, advance to the next level: leverage predictive analytics to forecast future demand and fine-tune inventory management.
Leverage predictive analytics for proactive management
Reactive pricing, adjusting rates after you see demand drop, costs you occupancy and revenue. Predictive analytics flips that logic. Instead of responding to what already happened, you act on what the data says is about to happen.
Predictive analytics and machine learning forecast demand using historical data, market trends, and guest behavior, enabling proactive pricing and inventory management. In practice, this means your system can detect that a music festival three weeks out is driving a 40% spike in searches and adjust your minimum stays and rates before your competitors react.
Key market signals worth monitoring continuously:
- Local event calendars: Concerts, sports events, conferences, and festivals drive short-term demand spikes.
- Competitor pacing: How quickly your competitors are filling their calendars is a real-time demand signal.
- Booking window trends: Are guests booking 90 days out or 10 days out? This shift tells you about market confidence and last-minute demand.
- Search trend data: Rising search volumes in your market, even before bookings materialize, indicate growing demand pressure.
- Weather and seasonal patterns: Historical weather data helps predict off-season booking behavior.
“Weekly review rhythms are where proactive operators separate themselves from reactive ones. A 30-minute weekly check against pacing benchmarks catches revenue opportunities that daily noise obscures.”
Cross-system integration is the key enabler here. When your channel data, guest communication history, and market intelligence feed into a single platform, AI can cleanse and merge inputs to produce more accurate forecasts. Fragmented data creates fragmented predictions. You can see how real-time booking sync across channels directly improves forecast accuracy by eliminating data lag between platforms.
Setting minimum stay rules predictively, extending minimum stays during high-demand windows and shortening them when demand softens, is one of the highest-impact adjustments most operators are not making systematically. Pairing this with predictive analytics for rentals creates a compounding revenue effect over time.
Predictive analytics unlock proactive management, but common pitfalls and data traps can undermine performance. Next, we troubleshoot key mistakes and teach how to avoid them.
Avoid common mistakes: Overpricing, data paralysis, and healthy KPIs
Even operators using sophisticated tools fall into predictable traps. Knowing what they are before you hit them saves both revenue and frustration.
Common pitfalls to watch for:
- Overpricing during shoulder seasons: Pushing rates too high when demand is moderate drives guests to competitors and tanks your occupancy.
- Ignoring demand signals: Using pricing rules without reviewing market pacing means you’re optimizing in a vacuum.
- Analysis paralysis: Tracking 30 metrics simultaneously without prioritizing which ones drive decisions leads to inaction.
- Neglecting data hygiene: Dirty data, duplicate listings, mismatched booking windows, creates flawed pricing recommendations that compound over time.
- Comp set mismatch: Comparing your three-bedroom property to a studio nearby distorts your ADR benchmarks and leads to misguided pricing decisions.
The data profitability myth in revenue management is that more data always equals more insight. It doesn’t. Overpricing reduces demand when RevPAR falls, and too much data leads to paralysis. Focus on high-impact signals and maintain rigorous data hygiene for your AI tools to function effectively.
“A property running at 90% occupancy can generate less total revenue than one at 70% if the ADR is set too low. Filling every night at the wrong rate is not a win.”
This balance between occupancy and ADR is where most operators get it wrong. They optimize for a full calendar and undercharge, or they push rates and watch occupancy collapse. The goal is maximizing RevPAR, not either metric in isolation.
Pro Tip: Choose five to seven metrics as your core decision set and build weekly reviews around them. Every other metric goes into a secondary report you check monthly. This prevents data overload while keeping you responsive to what matters.
Segmenting your portfolio into comp sets by property type, bedroom count, and location sharpens your benchmarking. A beachfront villa competes differently than an urban apartment, and your pricing strategy should reflect that. Reviewing rental management mistakes by category gives you a useful framework for auditing your own operations.
Tracking healthy occupancy and ADR balance across your portfolio helps you spot which properties are underperforming and why.
Verify results and iterate for sustainable growth
Optimization is not a one-time event. It’s a continuous cycle of measurement, adjustment, and reinvestment. After implementing dynamic pricing and predictive analytics, the next step is rigorous verification.
Metrics to review regularly:
- RevPAR vs. market index: Are you growing faster or slower than your comp set?
- NOI trend: Revenue gains should translate into net operating income gains, not just gross revenue.
- Occupancy rate by season: Identify which periods are underperforming and why.
- Guest satisfaction scores: Revenue strategy that degrades guest experience is unsustainable.
- Booking lead time: Shifts in when guests book signal changes in market confidence.
The results from operators who commit to this cycle are significant. Empirical benchmarks from real case studies show RevPAR and NOI increases of 18 to 44%, with dynamic pricing delivering 15 to 36% revenue uplift for properties that implement and iterate consistently.
Case study benchmarks: Revenue increases by approach
| Approach | RevPAR increase | NOI increase | Time to results |
|---|---|---|---|
| Dynamic pricing only | 15-20% | 10-18% | 60-90 days |
| Predictive analytics added | 22-30% | 18-28% | 90-120 days |
| Full automation + reporting | 30-44% | 25-36% | 120-180 days |
Iteration means weekly and daily reviews in the first quarter after implementation, then shifting to weekly once the system stabilizes. Seasonal adjustments, especially for markets with strong summer or winter demand cycles, should be planned 60 to 90 days in advance rather than reactively. Reviewing vacation rental best practices for your specific market type helps you calibrate these cycles.
Aligning your team and owner reporting cadence with your analytics reviews ensures that insights translate into decisions. Owners who receive transparent, data-backed performance reports are more likely to reinvest in property improvements that support higher ADR over time. Benchmarking rental growth systematically is what separates operators who plateau from those who compound gains year over year.
The missing piece: Why data maturity beats volume, and what experts won’t tell you
Most articles on rental revenue optimization focus on which tools to buy. That’s the wrong question. The real question is whether your data is mature enough to make those tools work.
Data maturity means your data is clean, continuous, consistent, and correctly mapped to decisions. It’s not about having more sources. It’s about having trustworthy sources. Operators who chase every new data feed end up with a fragmented, contradictory picture that makes AI recommendations unreliable. The data profitability myth is real: more data can actively hurt you if it’s not prioritized. Profitability metrics trump sheer volume when optimizing rental operations.
The operators who win long-term combine pricing discipline with two things most guides gloss over: retention and owner communication. Guest retention drives down acquisition costs and improves review scores, which in turn supports higher ADR. Owner communication, done well with clean data-backed reports, builds trust that enables faster decision-making on renovations, pricing changes, and expansion.
A strong revenue management approach combines pricing with retention, marketing alignment, and owner communication through data reports, segmenting the portfolio for accurate comp comparisons. This holistic approach is what converts a short-term revenue gain into a sustainable competitive advantage.
Our view is that most operators should spend the first 90 days not adding more tools, but cleaning and consolidating the data they already have. Then layer on AI-driven automation. Done in that order, the results from integrated reporting for rentals compound significantly faster than if you skip the foundation.
Next steps: Unlock your revenue potential with purpose-built tools
The strategies in this article work. But executing them manually across a growing portfolio of properties is where most operators hit their ceiling. You need infrastructure that does the heavy lifting automatically, from pricing adjustments to owner reports to maintenance escalation, so your team focuses on growth, not administration.
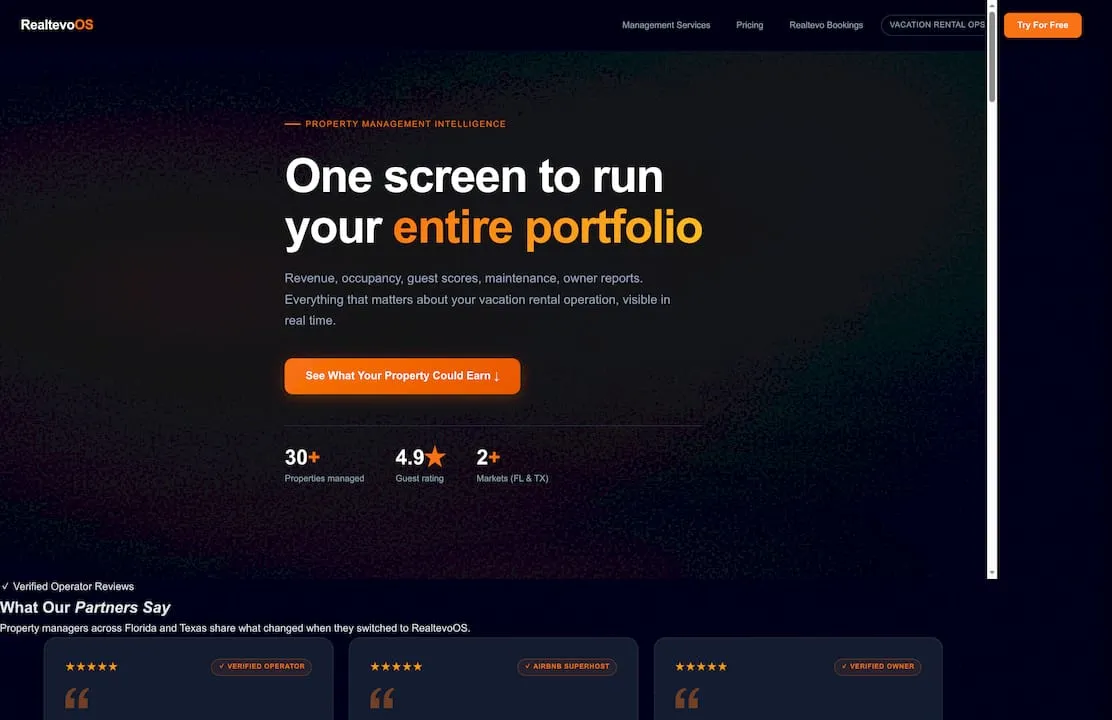
RealtevoOS is built specifically for property management companies operating at scale. It consolidates data from Airbnb, Vrbo, and other channels into a unified dashboard, automates dynamic pricing decisions, generates owner-ready performance reports, and flags maintenance issues before they become guest complaints. Every insight in this guide can be operationalized within the platform without stitching together separate tools. If you’re ready to move from spreadsheets to a system that actively manages your revenue, exploring what RealtevoOS offers is the most direct next step.
Pro Tip: When evaluating any platform, ask specifically how it handles data from multiple channels simultaneously and whether its reporting can be segmented by property type and market. These two capabilities separate enterprise-grade tools from entry-level options.
Frequently asked questions
What is dynamic pricing and how does it increase rental revenue?
Dynamic pricing uses real-time adjustment tools and AI to change rental rates based on demand signals, and it can increase revenue by 7 to 40% depending on market conditions and implementation quality.
Which metrics matter most for optimizing rental revenue?
The most critical metrics are RevPAR, NOI, ADR, occupancy rate, and guest satisfaction scores, and top operators consistently track all five together rather than in isolation.
How can predictive analytics improve vacation rental revenue?
Predictive analytics let operators anticipate demand shifts before they happen, and machine learning models using historical data enable proactive rate and inventory adjustments that capture revenue competitors miss.
What mistakes should rental operators avoid in revenue optimization?
The biggest errors are overpricing during soft demand periods, tracking too many metrics without acting on them, and ignoring the ADR and occupancy balance that actually drives profitability rather than just calendar fill rate.