Vacation rental analytics process: optimize revenue now
Unlock your revenue potential with the vacation rental analytics process. Learn to transform data into actionable insights for higher bookings!

Vacation rental analytics process: optimize revenue now
Most vacation rental managers know their occupancy rate. Far fewer know why it changed last month. That gap between data and interpretation is where revenue quietly disappears. The vacation rental analytics process is not about pulling reports and calling it done. It is about building a repeatable system that connects market signals to operational decisions, pricing adjustments, and revenue outcomes. This guide walks you through every stage, from collecting the right data to validating your findings and acting on them before your competitors do.
Table of Contents
- Understanding the vacation rental analytics landscape
- Preparing your data and analytics tools for effective insights
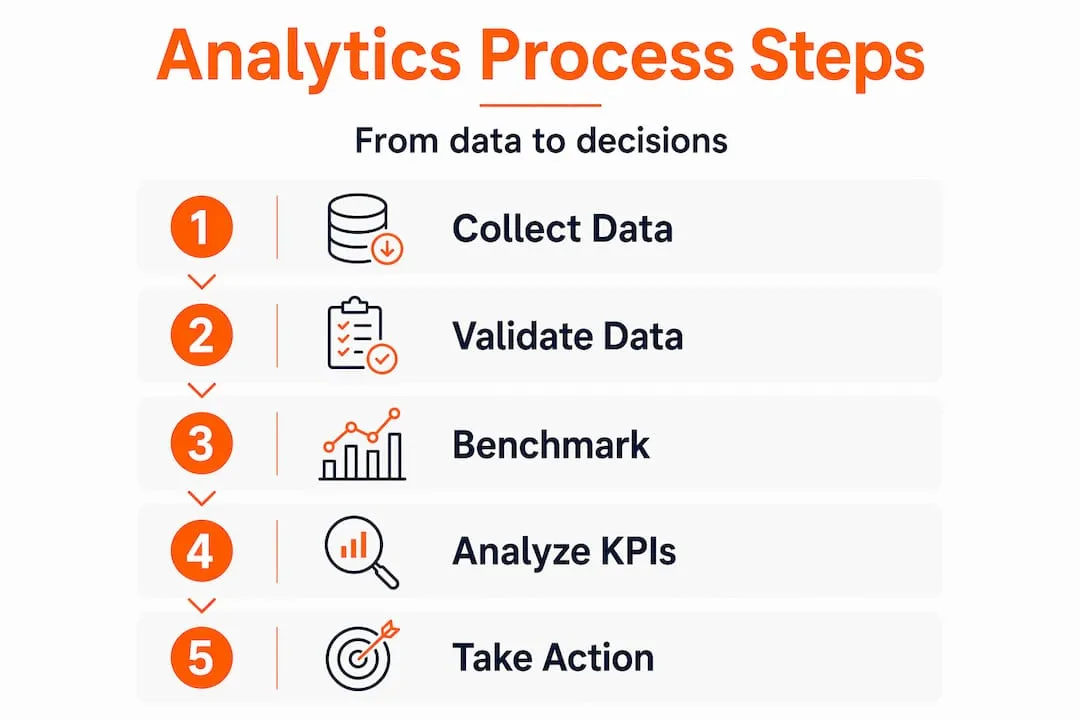
- Executing your vacation rental analytics process step by step
- Verifying results and turning analytics into actionable decisions
- Why most vacation rental managers get analytics wrong and how to fix it
- Optimize your vacation rental analytics with RealtevoOS
- Frequently asked questions
Key Takeaways
| Point | Details |
|---|---|
| Focus on core KPIs | Track occupancy, ADR, RevPAR, and booking pace aligned with your business goals. |
| Benchmark effectively | Use relevant comparable properties and market context to avoid misattributing revenue changes. |
| Use scenario analyses | Stress-test your income projections with optimistic, realistic, and conservative scenarios. |
| Leverage real-time data | React quickly to market changes using real-time analytics to optimize pricing and occupancy. |
| Maintain data hygiene | Clean and validate your data continuously to ensure accurate and actionable analytics. |
Understanding the vacation rental analytics landscape
Before you can run a useful analysis, you need to agree on what you are measuring and why. The role of analytics in vacation rental business decisions starts with defining your core KPIs clearly, because vague metrics produce vague strategies.
The five KPIs that actually matter:
- Occupancy rate: Booked nights divided by available nights. Simple, but only useful when compared against a relevant benchmark, not last year’s average.
- Average daily rate (ADR): Total room revenue divided by total nights sold. A rising ADR with falling occupancy is not automatically good news.
- RevPAR (revenue per available rental): ADR multiplied by occupancy. This is the single number that captures both pricing and demand in one figure.
- Booking pace: How far in advance your calendar is filling relative to a prior period or comparable set. This is a leading indicator.
- Lead time: The average gap between booking date and check-in date. Shortening lead times often signal weakening demand before occupancy numbers show it.
The distinction between lagging and leading indicators is one the industry constantly underuses. Occupancy and ADR are lagging: they tell you what happened. Booking pace and lead time are leading: they tell you what is about to happen. Running a vacation rental without tracking both is like driving by only checking your rearview mirror.
Benchmarking is where most managers make their first mistake. Comparing your property to the citywide average is almost always misleading. A downtown studio performing at 72% occupancy looks weak against a coastal market average of 85%, but it may be outperforming its actual submarket by 10 points. Benchmarking against a clean comp set and interpreting KPI moves in market context is essential to avoid misattribution.
| KPI | Definition | Lagging or leading | Strategic use |
|---|---|---|---|
| Occupancy rate | Booked nights / available nights | Lagging | Spot demand gaps; compare vs. comp set |
| ADR | Revenue / nights sold | Lagging | Track pricing power over time |
| RevPAR | ADR × occupancy | Lagging | Single revenue health metric |
| Booking pace | Calendar fill rate vs. prior period | Leading | Anticipate demand shifts 30–90 days out |
| Lead time | Days between booking and check-in | Leading | Detect demand softening early |
When leveraging third-party market comps for submarket benchmarking, the goal is not to find properties that look like yours superficially. It is to find properties that compete for the same guest at the same price point on the same nights.
Preparing your data and analytics tools for effective insights
Good analysis starts with clean inputs. Garbage data produces confident-sounding conclusions that lead you in the wrong direction. Here is how to build a solid foundation before you ever run a report.
- Collect your internal property data. Pull bookings, revenue, occupancy, cancellations, and expense records for each property. Go back at least 12 months to capture seasonality, and 24 months if you want to compare pre and post-market-shift behavior.
- Gather external market data. Market intelligence tools publish ADR and occupancy baselines at the zip code or submarket level. Understanding AirDNA Rentalizer metrics gives you a calibrated baseline for what your market can realistically support.
- Select 3 to 5 true comparable properties. Match on bedroom count, location within 1 to 2 miles, amenity tier, and listing quality. Do not use a five-bedroom beachfront as a comp for a three-bedroom condo three blocks from the water.
- Standardize your metric definitions. Occupancy means different things across platforms. Lock in one definition across your entire dataset. We use: booked days divided by total active available nights, excluding owner blocks unless they represent real revenue displacement.
- Prioritize tools with real-time or near real-time data. Markets move fast. A platform that refreshes weekly may already be showing you last week’s opportunity. Use market-level baseline data plus comparable listings to build scenario models that reflect current conditions, not historical averages.
- Audit your data before each analysis cycle. Check for duplicate bookings, missing revenue entries, and misaligned date fields. A single corrupt month of data can skew a rolling 90-day analysis significantly.
For managers scaling across multiple markets, using RealtevoOS for data integration consolidates OTA channel data and internal PMS records into one view, reducing the manual reconciliation step that eats hours every week.
Pro Tip: Build a short data validation checklist and run it before every monthly analysis. Check for duplicate records, gaps in booking data, and outlier transactions. Ten minutes of validation saves hours of troubleshooting downstream.

Executing your vacation rental analytics process step by step
This is where the vacation rental analytics process moves from preparation into action. The goal is not to generate more reports. It is to identify gaps, confirm strengths, and produce decisions.
- Run portfolio KPIs against your comp set. For each property, compare occupancy, ADR, and RevPAR against your 3 to 5 comps. A property with 68% occupancy and a comp set average of 75% has a 7-point gap worth investigating before assuming it is a pricing problem.
- Segment by rolling periods, not just annual. Annual averages hide too much. Pull 7-day, 30-day, and 90-day rolling windows. A 90-day view smooths noise. A 7-day view catches sudden shifts. Use both together to tell the difference between a trend and a blip.
- Build scenario-based projections. Model three scenarios using your comp set’s performance distribution. Optimistic assumes top 25% performance. Realistic uses the median. Conservative uses the bottom 25%. This is how you stress-test income forecasts without guessing.
- Diagnose occupancy changes. If occupancy drops, ask three questions before acting: Did pricing change? Did the listing’s distribution channels change? Did property quality or review scores shift? Each cause demands a different fix.
- Apply booking pace as a forward signal. If your calendar is 15% less filled 45 days out compared to the same point last year, that is an actionable signal right now, not after the month closes.
- Adjust pricing, marketing, and operations based on what the data shows. Real-time analytics helps you detect and react quickly to occupancy and pricing shifts to stay competitive, rather than reviewing results three weeks after the revenue opportunity has passed.
| Scenario | Occupancy assumption | ADR strategy | Operational implication |
|---|---|---|---|
| Optimistic (top 25%) | 85%+ | Hold or increase rates | Full staffing, proactive maintenance |
| Realistic (median) | 68–75% | Hold rates, test promotions | Standard staffing, monitor reviews |
| Conservative (bottom 25%) | Below 60% | Reduce rates, boost distribution | Reduce variable costs, review quality issues |
Pro Tip: Schedule a 30-minute weekly KPI review and a deeper 90-minute monthly analysis. The weekly session catches booking pace and lead time shifts. The monthly session validates whether your interventions from the prior period actually worked.
Verifying results and turning analytics into actionable decisions
Analysis without verification is just a hypothesis. Here is how to close the loop.
Validate your data continuously. Before acting on any trend, confirm it appears consistently across at least two data sources. A RevPAR drop that shows in your PMS but not in market data likely points to an internal issue, not a market-wide shift.
Set KPI-based alerts. Define thresholds that trigger a review automatically. For example: if 30-day forward occupancy drops more than 8 points below last year’s same period, trigger a pricing and distribution audit. If ADR rises more than 12% above your comp set median, check whether you are losing bookings to underpriced competitors.
“Applying AI analytics inward with clean data drives the biggest gains in vacation rental operations — not just using AI to respond to guests faster, but using it to catch operational drift before it costs you.”
Common pitfalls to avoid:
- Relying only on annual averages for any decision involving pricing or staffing
- Ignoring booking windows when evaluating occupancy performance
- Treating ADR increases as wins without checking if total RevPAR actually improved
- Skipping data hygiene and then wondering why your reports contradict each other
- Comparing properties across different submarkets as if they compete for the same guests
Translate findings into concrete actions. If booking pace is lagging 60 days out, reduce your minimum night stay. If cleaning cost per turnover is up 18% but review scores for cleanliness have not improved, that is a vendor conversation. If a channel is driving 40% of bookings but 70% of your cancellations, that channel needs rate fencing or deposit policy changes.
Using RealtevoOS analytics alerts lets you automate these thresholds across your entire portfolio so no single property slips through the cracks during a busy period.
Pro Tip: Revisit your alert thresholds every quarter. A threshold calibrated for a strong market will miss signals during a softening period. Static alerts on a dynamic market are barely better than no alerts at all.
Why most vacation rental managers get analytics wrong and how to fix it
Here is the uncomfortable part: most analytics processes in vacation rental management are theater. Managers pull dashboards, notice that occupancy is down or ADR is up, and then act on gut feel anyway. The reports exist to justify decisions that were already made, not to surface decisions that need to be made.
The root problem is misattribution. The reason owners miss revenue is often attribution. They see a revenue drop and immediately cut rates, when the actual driver was a distribution gap, a review quality decline, or a new competitor entering their exact submarket with better photos and a lower cleaning fee.
“Fixing the wrong variable costs time and money twice: once for the bad decision, and again when you finally diagnose the real problem.”
Vanity metrics compound the issue. Occupancy rate is the most watched and least understood KPI in this industry. A property running at 90% occupancy with an ADR 20% below its comp set is not winning. It is leaving money on the table while looking busy. RevPAR, booking pace, and lead time tell a more complete story, but they require more work to interpret, so they get ignored.
The managers who consistently outperform their markets share a specific habit: they break every KPI into rolling periods and always ask “compared to what?” before drawing a conclusion. They use RealtevoOS advanced analytics not as a reporting tool but as a decision framework. Every metric in their dashboard is connected to a specific action they will take if that metric crosses a defined threshold.
Analytics should never end at the report. It should end at the decision. Build your process around that principle and the reports become genuinely useful.
Optimize your vacation rental analytics with RealtevoOS
Running a disciplined vacation rental analytics process across five, ten, or fifty properties manually is not realistic. Data falls out of sync, alerts get missed, and the insights that should drive pricing decisions end up buried in spreadsheets.
RealtevoOS consolidates your PMS data and OTA market intelligence into a single live dashboard, enabling real-time benchmarking, booking pace monitoring, and scenario stress-testing across your entire portfolio. Automated KPI alerts flag occupancy drops and pricing gaps before they become revenue problems. The platform connects analytics directly to workflow automation, so the insight triggers the action without a manual step in between.

If you manage multiple properties and want to see how the analytics process described in this guide works inside a purpose-built system, book a free demo and consultation. The team will walk through your specific portfolio and show you exactly where the gaps are.
Frequently asked questions
What are the most important KPIs in the vacation rental analytics process?
Occupancy, ADR, RevPAR, booking pace, and lead time are the core KPIs. Focus on KPIs that directly influence revenue and operational decisions rather than surface-level metrics like total bookings or gross revenue alone.
How do I choose comparable properties for benchmarking?
Select 3 to 5 properties with matching bedroom counts, similar amenities, and proximity within the same submarket. Find 3 to 5 comparable listings matching bedroom count and amenities for benchmarking that is actually actionable.
Why is real-time analytics important in vacation rental management?
Market conditions shift fast, and weekly or monthly reports often show you opportunities that have already closed. Real-time analytics helps you detect and react quickly to occupancy and pricing shifts, which is the difference between capturing revenue and watching it go to a competitor.
How can scenario stress tests improve revenue projections?
Modeling optimistic, realistic, and conservative scenarios based on comp set percentile performance helps you avoid overconfident forecasts and plan staffing and pricing with actual ranges in mind. Run scenario-based stress tests using percentile performance bands to validate projections before committing to rates or budgets.
What are common mistakes to avoid in vacation rental analytics?
The biggest pitfalls are relying on annual averages, misattributing revenue changes to the wrong variable, ignoring booking windows, and letting data hygiene slip. Common pitfalls include comparing only annual averages and failing to interpret pacing and booking windows, both of which lead to late or incorrect decisions.