Vacation Rental KPIs: What They Are and Why They Matter
Discover what is vacation rental KPI and why it’s crucial for maximizing profits. Learn key metrics to drive your short-term rental success!

Vacation Rental KPIs: What They Are and Why They Matter
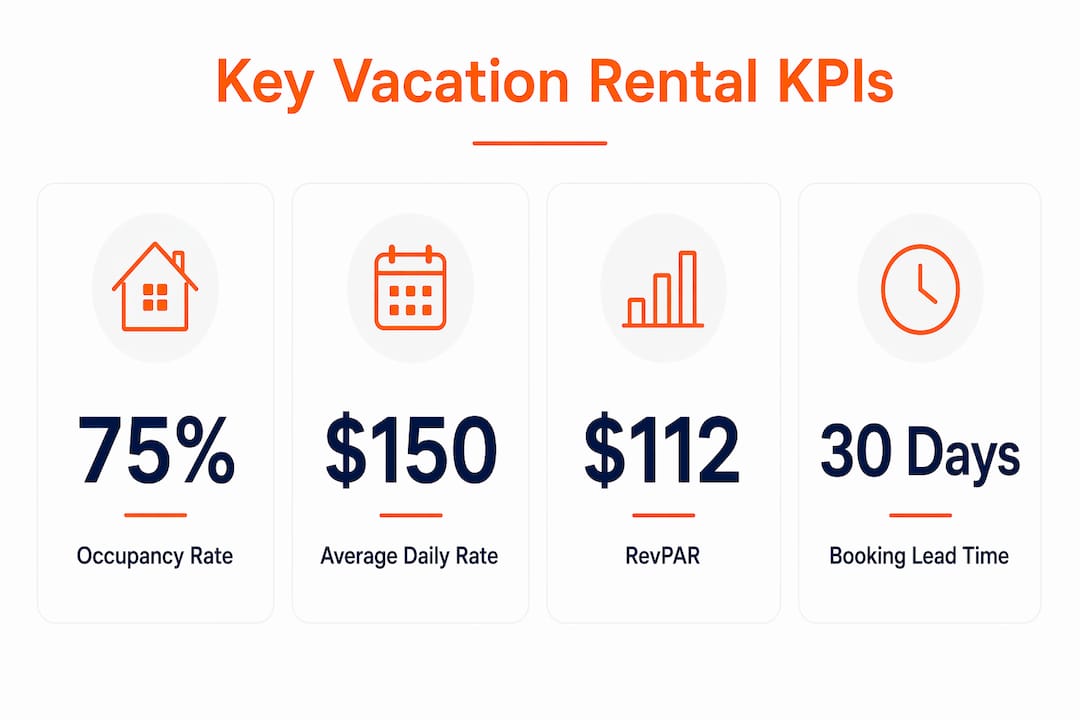
A vacation rental KPI (key performance indicator) is a measurable metric that tracks the financial and operational health of a short-term rental property. Property managers who rely on gut instinct instead of defined KPIs consistently leave revenue on the table. The three metrics that form the foundation of any serious rental operation are Occupancy Rate, Average Daily Rate (ADR), and Revenue per Available Room (RevPAR). Tools like PriceLabs automate the tracking of all three, giving managers a real-time picture of how each property performs against market benchmarks. Understanding what these vacation rental metrics mean, how to calculate them, and how to act on them is the difference between a reactive manager and a profitable one.
What are the key revenue KPIs for vacation rentals?
The three core revenue KPIs for vacation rentals are Occupancy Rate, ADR, and RevPAR. Each answers a different question about your property’s performance, and none of them tells the full story alone.
Occupancy rate
Occupancy Rate measures the percentage of nights booked out of total available nights. The basic formula is: Guest Nights divided by Total Nights. A property with 60 booked nights out of 100 available nights runs at 60% occupancy. The more accurate version is Adjusted Occupancy, which removes owner holds and offline blocks from the denominator. Using the same example, if 20 of those 100 nights were held for owner use, Adjusted Occupancy becomes 75% (60 divided by 80). Separating gross occupancy from paid occupancy gives you a far more honest read on how your property actually performs in the open market.

Average daily rate (ADR)
ADR is calculated by dividing total rental revenue by the number of booked guest nights. If your property generated $6,720 in revenue from 60 guest nights, your ADR is $112. ADR tells you how effectively you are pricing each night. A rising ADR with stable occupancy signals that your pricing strategy is working. A falling ADR alongside rising occupancy often signals the opposite: you are filling nights by undercharging.
RevPAR
RevPAR combines ADR and Occupancy Rate into one figure. You calculate it two ways: multiply ADR by Occupancy Rate, or divide total unit revenue by total nights in the period. Using the numbers above, RevPAR equals $67.20 ($112 multiplied by 60%). RevPAR is widely considered the single most useful revenue health indicator because it captures both pricing power and utilization in one number. A property with high ADR but low occupancy and a property with high occupancy but low ADR can both produce the same RevPAR, which immediately flags where the real problem lies.
| KPI | What it measures | Formula |
|---|---|---|
| Occupancy Rate | Percentage of nights booked | Guest Nights ÷ Total Available Nights |
| ADR | Average price per booked night | Total Revenue ÷ Guest Nights |
| RevPAR | Combined pricing and utilization | ADR × Occupancy Rate |
Pro Tip: RevPAR is the most comprehensive single revenue KPI because it penalizes both underpricing and underoccupancy simultaneously. Track it weekly, not just monthly, to catch pricing drift before it compounds.
Which booking and operational KPIs matter beyond revenue?
Revenue metrics tell you what happened. Booking and operational KPIs tell you what is about to happen and how efficiently your property runs between stays.
- Average Booking Window (Booking Lead Time): The number of days between a reservation and check-in. Typical ranges vary sharply by market: urban business travelers book 7 to 21 days out, leisure travelers 14 to 35 days, beach and coastal markets 45 to 90 days, and holiday or event-driven markets 60 to 120-plus days. Knowing your market’s typical window tells you when demand is building and when it is stalling.
- Average Length of Stay (ALOS): The mean number of nights per booking. Longer stays reduce turnover costs, cleaning fees, and vacancy gaps between reservations. A beach property averaging 7-night stays operates very differently from an urban apartment averaging 2 nights.
- Unit Revenue: Total revenue generated by a single property over a defined period. This is the portfolio-level metric that shows which properties are pulling their weight and which are dragging down your average.
- Cancellation Rate: The percentage of confirmed bookings that cancel before check-in. A rising cancellation rate signals problems with your listing accuracy, pricing relative to refund policies, or platform-specific issues on Airbnb or Vrbo.
Booking lead time is also a forward-looking demand signal. When your booking window shrinks unexpectedly, it often means demand is softening and you need to adjust pricing before the calendar fills with low-value last-minute bookings.
Pro Tip: If your booking window suddenly shortens by more than 30%, treat it as an early warning sign. Lower your rate threshold for the affected dates immediately rather than waiting for the occupancy gap to become obvious.
How should vacation rental managers interpret and apply KPI data?
Tracking KPIs without analyzing how they relate to each other is one of the most common mistakes in rental management. High occupancy with low ADR is not a success story. It signals that you are filling nights by underpricing, which means you are working harder for less revenue per booking. The correct response is to raise rates and accept a modest occupancy dip, which often produces higher RevPAR overall.
Here are the most important interpretation principles:
- Never read occupancy in isolation. A 90% occupancy rate at $80 ADR produces a RevPAR of $72. An 80% occupancy rate at $110 ADR produces a RevPAR of $88. The second scenario generates more revenue with fewer bookings and lower operational costs.
- RevPAR has a blind spot. Operational costs are excluded from RevPAR, so it cannot tell you whether a property is actually profitable. A high RevPAR property with heavy cleaning costs, frequent maintenance, and high platform fees can still produce a poor net operating income (NOI). Always pair RevPAR with a cost-side metric.
- Benchmark against your market, not national averages. A 65% occupancy rate in a seasonal beach market during peak summer is underperformance. The same rate in an off-season mountain market might be exceptional. Context determines whether a KPI reading is good or bad.
- Track trends, not snapshots. A single month’s data is noise. Three months of directional movement in ADR, occupancy, or RevPAR is a signal worth acting on.
Platforms like PriceLabs automate KPI tracking and dynamic pricing, adjusting rates in response to real-time occupancy and booking window data. For managers running multiple properties, automation is not a luxury. Manual rate adjustments across a portfolio of 10 or more units introduce lag that costs revenue every week. You can also explore KPI reporting templates to structure how you review this data on a regular cadence.
How do vacation rental KPIs vary by market and season?
Market type and season are the two variables that most dramatically shift what a “good” KPI looks like. Booking windows differ significantly between urban and leisure markets, and those differences cascade into occupancy patterns and pricing strategy.
| Market type | Typical booking window | Peak occupancy season | ADR pattern |
|---|---|---|---|
| Urban business | 7 to 21 days | Year-round with weekday peaks | Moderate, stable |
| Leisure / suburban | 14 to 35 days | Summer and holidays | Moderate, seasonal spikes |
| Beach / coastal | 45 to 90 days | Summer | High seasonal peak, low off-season |
| Holiday / event-driven | 60 to 120-plus days | Event-specific | Sharp spikes around events |
A beach property manager who expects bookings to fill within two weeks of check-in will consistently underperform. That market books months in advance, and pricing decisions need to be made long before the calendar looks full. Conversely, an urban manager who locks in rates 90 days out misses the opportunity to capture last-minute business travel demand at premium prices.
Seasonal occupancy shifts also affect how you weight ADR versus occupancy in your strategy. During peak season, the priority is maximizing ADR because demand is strong enough to absorb higher prices. During shoulder and off-season periods, the priority shifts toward maintaining occupancy to cover fixed costs. Managers who apply the same pricing logic year-round leave significant revenue uncaptured. For a deeper look at how market data benchmarks apply to growth planning, the 2026 vacation rental marketing guide covers occupancy and ADR benchmarks by property type.
What tools and practices support effective KPI tracking?
Effective KPI management requires both the right tools and a consistent review process. Here is what a well-structured tracking practice looks like:
- Use a revenue management platform. PriceLabs integrates occupancy, ADR, and RevPAR data and adjusts pricing dynamically based on market conditions. This removes the manual work of daily rate checks and reduces the risk of pricing errors across a large portfolio.
- Set benchmarks before you start tracking. A KPI without a baseline is just a number. Establish your property’s historical averages for each metric, then measure performance against those baselines and against comparable properties in your market.
- Review KPIs on a structured schedule. Daily reviews should cover booking pace and cancellation alerts. Weekly reviews should assess occupancy trends and ADR movement. Monthly reviews should evaluate RevPAR, unit revenue, and NOI against targets.
- Add guest satisfaction metrics. Review scores on Airbnb and Vrbo directly affect search ranking and booking conversion. A property with a 4.9-star average consistently outbooks a comparable 4.5-star property, even at higher rates. Guest satisfaction is a KPI that feeds every revenue metric downstream.
- Track direct booking rate. The percentage of bookings that come through your own website versus third-party platforms affects your net revenue per booking. Higher direct booking rates mean lower commission costs and better profit margins.
For managers looking to scale beyond a handful of properties, rental management intelligence systems provide a structured overview of the software tools that automate KPI tracking at portfolio scale.
Key takeaways
Vacation rental KPIs only produce results when managers track them together, benchmark them against their specific market, and act on the patterns they reveal over time.
| Point | Details |
|---|---|
| RevPAR is the top revenue KPI | It combines ADR and occupancy into one figure, exposing both pricing and utilization gaps. |
| Adjusted Occupancy beats gross occupancy | Removing owner holds from the denominator gives a more accurate performance read. |
| Booking window signals future demand | A shrinking lead time is an early warning to adjust pricing before gaps appear on the calendar. |
| RevPAR excludes costs | Pair it with NOI or cost-side metrics to assess true profitability, not just revenue health. |
| Market context defines good performance | A 65% occupancy rate means different things in a beach market versus an urban market. |
Why I stopped trusting any single KPI
I spent the first two years of managing a multi-property portfolio obsessing over occupancy. Every week I checked whether the calendar was full, and when it was, I felt like the operation was running well. It took a full year-end review to realize that my best-performing property by occupancy was also my lowest-margin property. It was booked nearly every night at rates that barely covered cleaning and platform fees.
The shift that actually changed my results was learning to read RevPAR alongside NOI, not just occupancy. Once I started treating high occupancy with low ADR as a warning sign rather than a win, I raised rates on three properties, accepted a short-term occupancy dip, and watched monthly revenue climb. The calendar looked less full. The bank account disagreed.
The other lesson I would pass on is this: static KPI tracking is almost useless. A spreadsheet you update once a month tells you what already happened. The managers who consistently outperform their markets are the ones using tools that surface booking pace changes and demand shifts in real time, so they can respond before the revenue opportunity closes. Platforms that integrate live data from Airbnb and Vrbo and surface it in a single dashboard are not a convenience. They are the operational infrastructure that makes data-driven decisions possible at scale. For anyone managing more than five properties, the role of data in property management is worth reading before your next pricing review.
— Jose
See your KPIs in one place with Realtevoos
Managing vacation rental KPIs across multiple properties without a centralized system means slower decisions and missed revenue. Realtevoos is built specifically for property managers who need real-time visibility across their entire portfolio.

The Realtevoos platform consolidates occupancy, ADR, RevPAR, and booking pace data from Airbnb and Vrbo into a single dashboard, with AI-driven automation that flags performance changes before they become problems. Property managers using Realtevoos report saving several hours each week on manual reporting, freeing time for the strategic decisions that actually grow revenue. If you are ready to move from reactive management to data-driven operations, Realtevoos is where that shift starts.
FAQ
What is a vacation rental KPI?
A vacation rental KPI is a measurable metric used to evaluate the financial and operational performance of a short-term rental property. Common examples include Occupancy Rate, ADR, RevPAR, and Average Booking Window.
How is RevPAR calculated for a vacation rental?
RevPAR equals ADR multiplied by Occupancy Rate, or total unit revenue divided by total nights in the period. For example, a property with a 60% occupancy rate and a $112 ADR produces a RevPAR of $67.20.
What is a good occupancy rate for a vacation rental?
A good occupancy rate depends entirely on market type and season. Beach markets typically target 70% or higher during peak summer, while urban markets may consider 60% to 65% strong given year-round demand patterns.
Why does booking lead time matter as a KPI?
Booking lead time tells you how far in advance guests are reserving, which signals demand strength and informs when to adjust pricing. A shortening booking window is an early indicator of softening demand that requires a pricing response before gaps appear.
Can RevPAR tell me if my rental is profitable?
RevPAR measures revenue health but excludes operational costs, so it cannot determine profitability on its own. Pair it with net operating income (NOI) or a cost-per-booking metric to get a complete picture of your property’s financial performance.
Recommended
- Operational Reporting for Vacation Rentals: 2026 Guide — Realtevo Blog
- Enterprise property management: Data-driven success for vacation rentals — Realtevo Blog
- Property Management Reporting Examples for Vacation Rentals — Realtevo Blog
- Predictive Maintenance for Vacation Rentals Explained — Realtevo Blog