Why Measure Rental Efficiency: A 2026 Guide
Discover why measure rental efficiency is crucial for maximizing profits. Uncover hidden costs and optimize your rental strategy for sustainable growth.

Why Measure Rental Efficiency: A 2026 Guide
Rental efficiency is defined as the net income a property generates relative to every resource invested, covering far more than rent collected or occupancy rates. Most vacation rental managers track bookings and nightly rates, yet miss the hidden costs of turnover, maintenance, and tenant quality that quietly erode margins. The importance of rental efficiency lies in its ability to expose those gaps and give you a complete picture of profitability. A six-lever optimization system developed by SmartScreen shows that tenant quality, strategic upgrades, dynamic pricing, vacancy reduction, cost control, and ancillary revenue together drive far more net operating income growth than rent increases alone. Understanding why measure rental efficiency is the first step toward managing a portfolio that grows sustainably.
Why measure rental efficiency and what it actually captures
Rental efficiency assessment starts with one question: how much net income does each property produce per dollar of resource spent? That framing separates it from gross rent or occupancy, which measure activity rather than profitability. A property booked 90% of the year but plagued by high turnover and deferred maintenance can still lose money on a net basis.
The core metrics you need to track fall into two categories: revenue-side and cost-side indicators.
Revenue-side metrics:
- Net operating income (NOI): Total revenue minus all operating expenses, excluding financing. NOI is the single most reliable indicator of rental efficiency because it captures both income and cost simultaneously.
- Net effective rent (NER): The actual rent received after accounting for concessions, free nights, and promotional discounts. NER amortizes concessions and turnover capital expenditures to reveal real profitability, not headline rates.
- Ancillary revenue per booking: Income from add-ons like early check-in, parking, or experience packages. SmartScreen’s model attributes 10% of NOI improvement to ancillary revenue, making it a measurable lever rather than a bonus.
Cost-side metrics:
- Tenant acquisition cost (TAC): Total spend on marketing, screening, and onboarding divided by new bookings or tenants secured. High TAC signals leasing inefficiency.
- Vacancy rate and absorption speed: How quickly units fill after turnover. Faster lease-ups can increase TAC or deepen concessions, so speed alone is not a success metric.
- Turnover cost per unit: Cleaning, repairs, and lost revenue during vacancy, calculated per transition.
Pro Tip: Track NER alongside your listed nightly rate every month. A widening gap between the two is the earliest signal that your pricing or concession strategy is eroding profitability before it shows up in your bank account.
These metrics interrelate in ways that make siloed tracking misleading. A drop in TAC looks positive until you realize it came from skipping tenant screening, which then drives up turnover costs six months later. Measuring them together, as a composite rental performance framework, gives you the full picture.
How rental efficiency and utilization differ
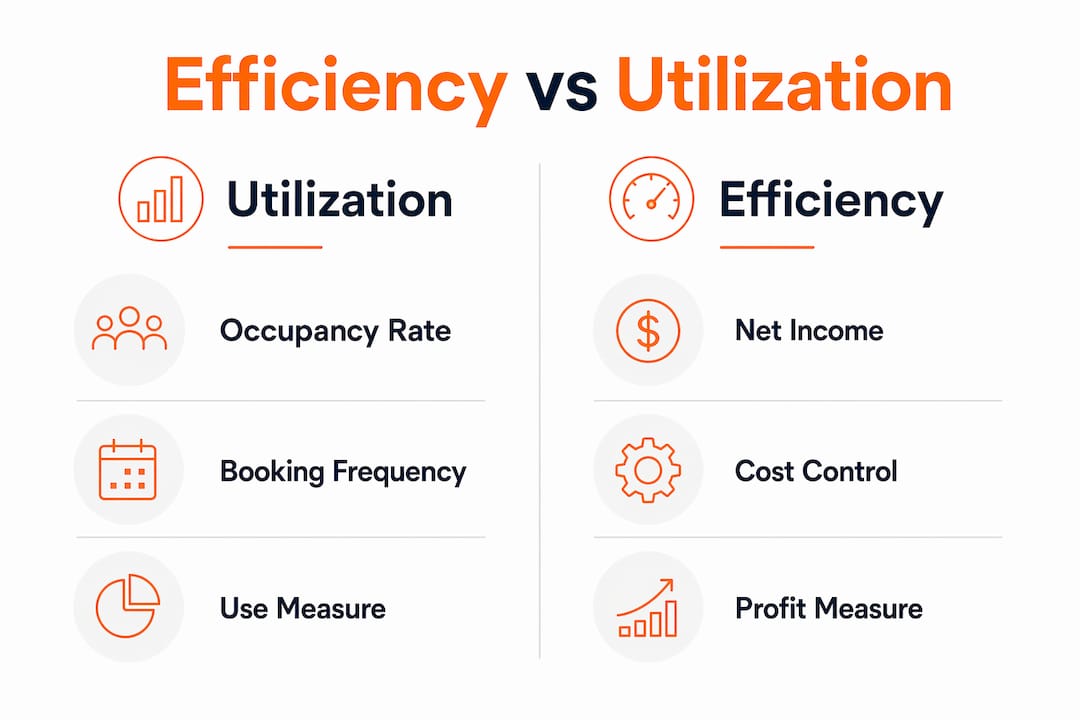
Utilization measures how often a property is occupied or in use. Efficiency measures how profitably it operates per unit of effort and expense. The distinction matters because high utilization can mask excessive labor, rushed maintenance, and administrative overhead that cut into margins despite apparent success.
| Metric | Utilization | Efficiency |
|---|---|---|
| What it measures | Occupancy rate or booking frequency | Net income per resource invested |
| What it misses | Labor, maintenance, and turnover costs | Raw activity level |
| Risk of optimizing it alone | High occupancy with low or negative NOI | Underutilized assets with strong margins |
| Best used for | Demand forecasting and pricing signals | Profitability and portfolio health decisions |
Consider a vacation rental booked every weekend at a competitive nightly rate. On the surface, utilization looks strong. But if each turnover requires four hours of cleaning labor, a maintenance call every third stay, and a guest acquisition cost of $80 per booking through paid channels, the actual margin per night may be lower than a property booked 60% of the time with lower turnover friction and direct bookings.
Predictive maintenance tracking addresses exactly this gap. When you monitor maintenance response times and unit turnover trends as early warning systems, you catch the operational drag before it compounds into a portfolio-level problem.

Pro Tip: Calculate your true cost-per-occupied-night by adding cleaning labor, platform fees, and a prorated maintenance reserve to your operating costs. Compare that number across properties monthly. The outliers will surprise you.
What role does energy efficiency play in rental performance?
Energy efficiency is a direct financial lever in rental efficiency assessment, not a separate sustainability concern. Rental homes use 20% more energy per square foot than owner-occupied homes. In New South Wales, only 22% of rental homes have insulation compared to 54% of owner-occupied properties, and renters spend roughly $150 more annually on energy as a result. For vacation rentals, those costs often fall on the operator through utility-inclusive pricing or guest complaints about comfort.
The financial case for upgrades is well documented. Meeting minimum energy efficiency standards yields annual renter energy cost savings between $160 and $750 per property, and the projected net present value for the Australian rental sector from energy upgrades reaches $24.8 billion by 2050. Those figures translate directly into higher NOI and stronger asset values for individual operators.
Energy upgrades also affect tenant retention and market appeal. Guests and long-term tenants increasingly factor energy costs and comfort into booking and renewal decisions. A property with modern insulation, efficient HVAC, and smart thermostats commands higher rates and lower vacancy.
The structural barrier here is the landlord-tenant split incentive. Landlords pay for upgrades but tenants capture the utility savings, which discourages investment. Vacation rental operators who include utilities in their pricing model actually benefit directly from efficiency upgrades, making the ROI calculation more straightforward than for traditional landlords. Practical upgrade priorities include:
- Ceiling and wall insulation, which delivers the highest energy cost reduction per dollar invested
- Heat pump water heaters, which cut water heating costs by up to 70% compared to electric resistance units
- Smart thermostats and occupancy sensors, which reduce energy waste between guest stays
- LED lighting throughout, which reduces lighting energy use by roughly 75% with a payback period under two years
How to implement rental efficiency measurements in practice
Measuring rental efficiency requires moving from intuition to a structured data practice. Replacing gut feel with metrics improves operational decisions and gives you early flags before problems escalate into revenue loss.
Here is a practical implementation sequence:
-
Establish your baseline NOI per property. Pull the last 12 months of revenue and operating expenses for each unit. Calculate NOI and cost-per-occupied-night. This baseline is your benchmark for every future decision.
-
Prioritize tenant screening as your highest-ROI investment. Tenant screening generates ROI upwards of 13,867% on screening cost by reducing evictions and turnover. A high-quality tenant averages 2.8 years of tenure versus one year for a low-quality placement, increasing lifetime value by $41,825 on a $2,000 per month unit. For vacation rentals, the equivalent is guest vetting and review-based filtering.
-
Implement dynamic pricing tied to demand signals. Dynamic pricing accounts for 18% of NOI improvement in SmartScreen’s six-lever model. Tools that pull real-time data from Airbnb and Vrbo allow you to adjust rates based on local demand, competitor availability, and seasonal patterns rather than fixed seasonal schedules.
-
Track vacancy costs explicitly. Every unbooked night has a cost: lost revenue plus the fixed operating expenses that continue regardless. Vacancy reduction drives 16% of NOI improvement according to SmartScreen’s research. Quantifying vacancy cost per property motivates faster action on pricing adjustments and marketing spend.
-
Plan and budget strategic upgrades. SmartScreen attributes 20% of NOI improvement to strategic property improvements. Prioritize upgrades with the shortest payback periods: energy efficiency measures, guest experience improvements, and amenities that support higher nightly rates or longer stays.
-
Use operational reporting tools to automate metric tracking. Manual spreadsheets break down at scale. Platforms that consolidate data across properties and generate automated reports let you monitor all six efficiency levers without adding administrative hours.
Pro Tip: Set a monthly efficiency review cadence. Review NOI, NER, vacancy rate, and cost-per-occupied-night for every property in one session. Patterns across properties reveal systemic issues that property-by-property reviews miss entirely.
For managers scaling beyond five properties, real-time booking monitoring adds another layer of visibility, catching demand shifts before they create avoidable vacancy gaps. The vacation rental revenue strategies that consistently outperform rely on this kind of integrated data practice rather than periodic manual reviews.
Key takeaways
Measuring rental efficiency holistically requires tracking NOI, NER, vacancy cost, tenant acquisition cost, and energy performance as a composite metric rather than relying on any single indicator.
| Point | Details |
|---|---|
| Efficiency beats utilization | High occupancy without cost control produces low or negative NOI. |
| Six levers drive NOI | Tenant quality, upgrades, pricing, vacancy, cost control, and ancillary revenue each contribute measurably. |
| Energy upgrades pay off | Annual savings of $160 to $750 per property improve NOI and tenant retention directly. |
| Screening ROI is exceptional | Tenant screening delivers over 13,000% ROI by reducing turnover and increasing tenant lifetime value. |
| Data replaces guesswork | Tracking maintenance trends and vacancy costs as early warning signals prevents compounding revenue loss. |
The metric most managers ignore until it’s too late
I have reviewed the financials of dozens of vacation rental portfolios over the years, and the pattern is almost always the same. Managers know their occupancy rate to the decimal point. They can quote their average nightly rate from memory. But ask them their cost-per-occupied-night or their net effective rent after concessions, and the room goes quiet.
The uncomfortable truth is that occupancy and nightly rate are the metrics that feel good to track. They go up when you run a promotion or drop your price. They respond to effort in ways that are immediately visible. Efficiency metrics are slower and more demanding. They require you to account for the cleaning crew overtime, the emergency plumber, the guest who left a one-star review and got a full refund. Those numbers are harder to look at, which is exactly why they matter more.
The managers I have seen build genuinely profitable portfolios treat efficiency as a discipline, not a report. They review their NOI per property monthly, not quarterly. They know which units are dragging the portfolio average down and why. They make upgrade decisions based on payback periods, not aesthetics. And they use platforms like Realtevoos to automate the data collection so the discipline does not collapse under the weight of manual work.
Start with one metric you are not currently tracking. Calculate your true cost-per-occupied-night for your lowest-performing property. That single number will tell you more about where your money is going than a year of occupancy reports.
— Jose
How Realtevoos helps you track and improve rental efficiency
Realtevoos is built specifically for vacation rental operators who want to move beyond occupancy dashboards and into real profitability management.

The Realtevoos platform consolidates operational data from Airbnb, Vrbo, and your direct booking channels into a single dashboard, giving you NOI, vacancy costs, and maintenance trends across your entire portfolio in real time. AI-driven automation handles routine reporting, guest communications, and performance alerts, so your team spends time on decisions rather than data entry. Property managers using Realtevoos report saving several hours each week on manual reporting alone. If you are ready to measure what actually drives profitability, Realtevoos gives you the tools to do it at scale. Explore the rental operations scaling guide to see how operators are building efficiency-first portfolios in 2026.
FAQ
What is rental efficiency and how does it differ from occupancy?
Rental efficiency measures net income generated per resource invested, while occupancy measures only how often a property is booked. A property can have high occupancy and low efficiency if turnover costs, maintenance, and labor erode the margin.
Which metric most directly measures rental performance?
Net operating income (NOI) is the most direct measure of rental performance because it captures both revenue and operating costs in a single figure. Tracking NOI alongside net effective rent reveals whether pricing and concession strategies are actually profitable.
Why does tenant quality affect rental efficiency so much?
Tenant quality drives 24% of NOI improvement in SmartScreen’s six-lever model because high-quality tenants stay longer, cause less damage, and reduce turnover costs. A high-quality tenant averages 2.8 years of tenure compared to one year for a low-quality placement.
How does energy efficiency connect to rental profitability?
Energy upgrades reduce operating costs directly, with annual savings of $160 to $750 per property documented by the NSW Government’s energy efficiency investigation. For vacation rentals with utility-inclusive pricing, those savings flow directly to the operator’s bottom line.
How often should vacation rental managers review efficiency metrics?
Monthly reviews of NOI, vacancy rate, cost-per-occupied-night, and net effective rent give managers enough frequency to catch problems early without creating reporting overhead. Quarterly reviews are too infrequent to catch seasonal demand shifts or maintenance cost spikes before they compound.
Recommended
- Rental Operations Scaling Process: A 2026 Guide — Realtevo Blog
- Rental management intelligence systems: What they do and why they matter — Realtevo Blog
- Operational Reporting for Vacation Rentals: 2026 Guide — Realtevo Blog
- Enterprise property management: Data-driven success for vacation rentals — Realtevo Blog